Discover data with Catalog StarterEnterpriseEnterprise +
With Catalog, you can view your project's resources (such as models, tests, and metrics), their lineage, and model consumption to gain a better understanding of its latest production state.
Use Catalog to navigate and manage your projects within dbt to help you and other data developers, analysts, and consumers discover and leverage your dbt resources. Catalog integrates with the Studio IDE, dbt Insights, Orchestrator, and Canvas to help you develop or view your dbt resources.
Prerequisites
- You have a dbt account on the Starter, Enterprise, or Enterprise+ plan.
- You have set up a production or staging deployment environment for each project you want to explore.
- You have at least one successful job run in the deployment environment. Note that CI jobs do not update Catalog.
- You are on the Catalog page. To do this, select Catalog from the top-level navigation in dbt.
Generate metadata
Catalog uses the metadata provided by the Discovery API to display the details about the state of your dbt project. The metadata that's available depends on the deployment environment you've designated as production or staging in your dbt project.
Catalog also allows you to ingest metadata from your data warehouse, giving you visibility into external resources in Catalog. For information on supported warehouses, refer to External metadata ingestion.
dbt metadata
If you're using a hybrid project setup and uploading artifacts from dbt Core, make sure to follow the setup instructions to connect your project in dbt. This enables Catalog to access and display your metadata correctly.
- To ensure all metadata is available in Catalog, run
dbt buildanddbt docs generateas part of your job in your production or staging environment. Running these two commands ensures all relevant metadata (like lineage, test results, documentation, and more) is available in Catalog. - Catalog automatically retrieves the metadata updates after each job run in the production or staging deployment environment so it always has the latest results for your project. This includes deploy and merge jobs.
- Note that CI jobs don't update Catalog. This is because they don't reflect the production state and don't provide the necessary metadata updates.
- To view a resource and its metadata, you must define the resource in your project and run a job in the production or staging environment.
- The resulting metadata depends on the commands executed by the jobs.
When dbt creates model metadata
dbt populates a model's metadata in Catalog when both of the following conditions are met:
- The model is defined in your dbt project (it exists in the manifest).
- The model appears in the
run_resultsof adbt build,dbt run, ordbt clonecommand, regardless of the run's success or failure status. Note thatdbt docs generatealone does not create model entries in Catalog. It provides supplementary metadata like column details and descriptions for models that already exist.
When dbt removes model metadata
dbt removes a model's metadata from Catalog in these two cases:
- Model removed from project: If a model is deleted from your dbt project (and therefore no longer exists in the manifest), its metadata is removed after a subsequent job run in which the model is no longer included.
- Environment inactivity: If an environment has had no job runs in the past 3 months, all metadata for that environment is purged. To prevent this, schedule jobs to run at least once every 3 months.
| Loading table... |
If your organization works in both dbt Core and Cloud, you can unify these workflows by automatically uploading dbt Core artifacts into dbt Cloud and viewing them in Catalog for a more connected dbt experience. To learn more, visit hybrid projects.
External metadata ingestion Preview
Connect directly to your data warehouse with external metadata ingestion, giving you visibility into tables, views, and other resources that aren't defined in dbt with Catalog.
We create dbt metadata and pull external metadata. Catalog uses the metadata provided by the Discovery API to display details about the state of your project. The available metadata depends on which deployment environment you’ve designated as production or staging in your dbt project.
Catalog overview
Catalog introduces the ability to widen your search by including dbt resources (models, seeds, snapshots, sources, exposures, and more) across your entire account. This broadens the results returned and gives you greater insight into all the assets across your dbt projects. Learn more in Global navigation or in our video overview.
Navigate the Catalog overview page to access your project's resources and metadata. The page includes the following sections:
- Search bar — Search for resources in your project by keyword. You can also use filters to refine your search results.
- Sidebar — Use the left sidebar to browse your project's resources, file tree, and database in the lower section of the sidebar. You can also browse model performance and project recommendations depending on your plan. Refer to Availability by plan for more info.
- Find your project recommendations within your project's landing page.*
- Lineage graph — Explore your project's or account's lineage graph to visualize the relationships between resources.
- ERD view — Explore structural relationships between models to understand potential join paths and connecting keys for analysis. Alpha
- Latest updates — View the latest changes or issues related to your project's resources, including the most recent job runs, changed properties, lineage, and issues.
- Marts and public models — View the marts and public models in your project. You can also navigate to all public models in your account through this view.
- Model query history — Use model query history to track consumption queries on your models for deeper insights.
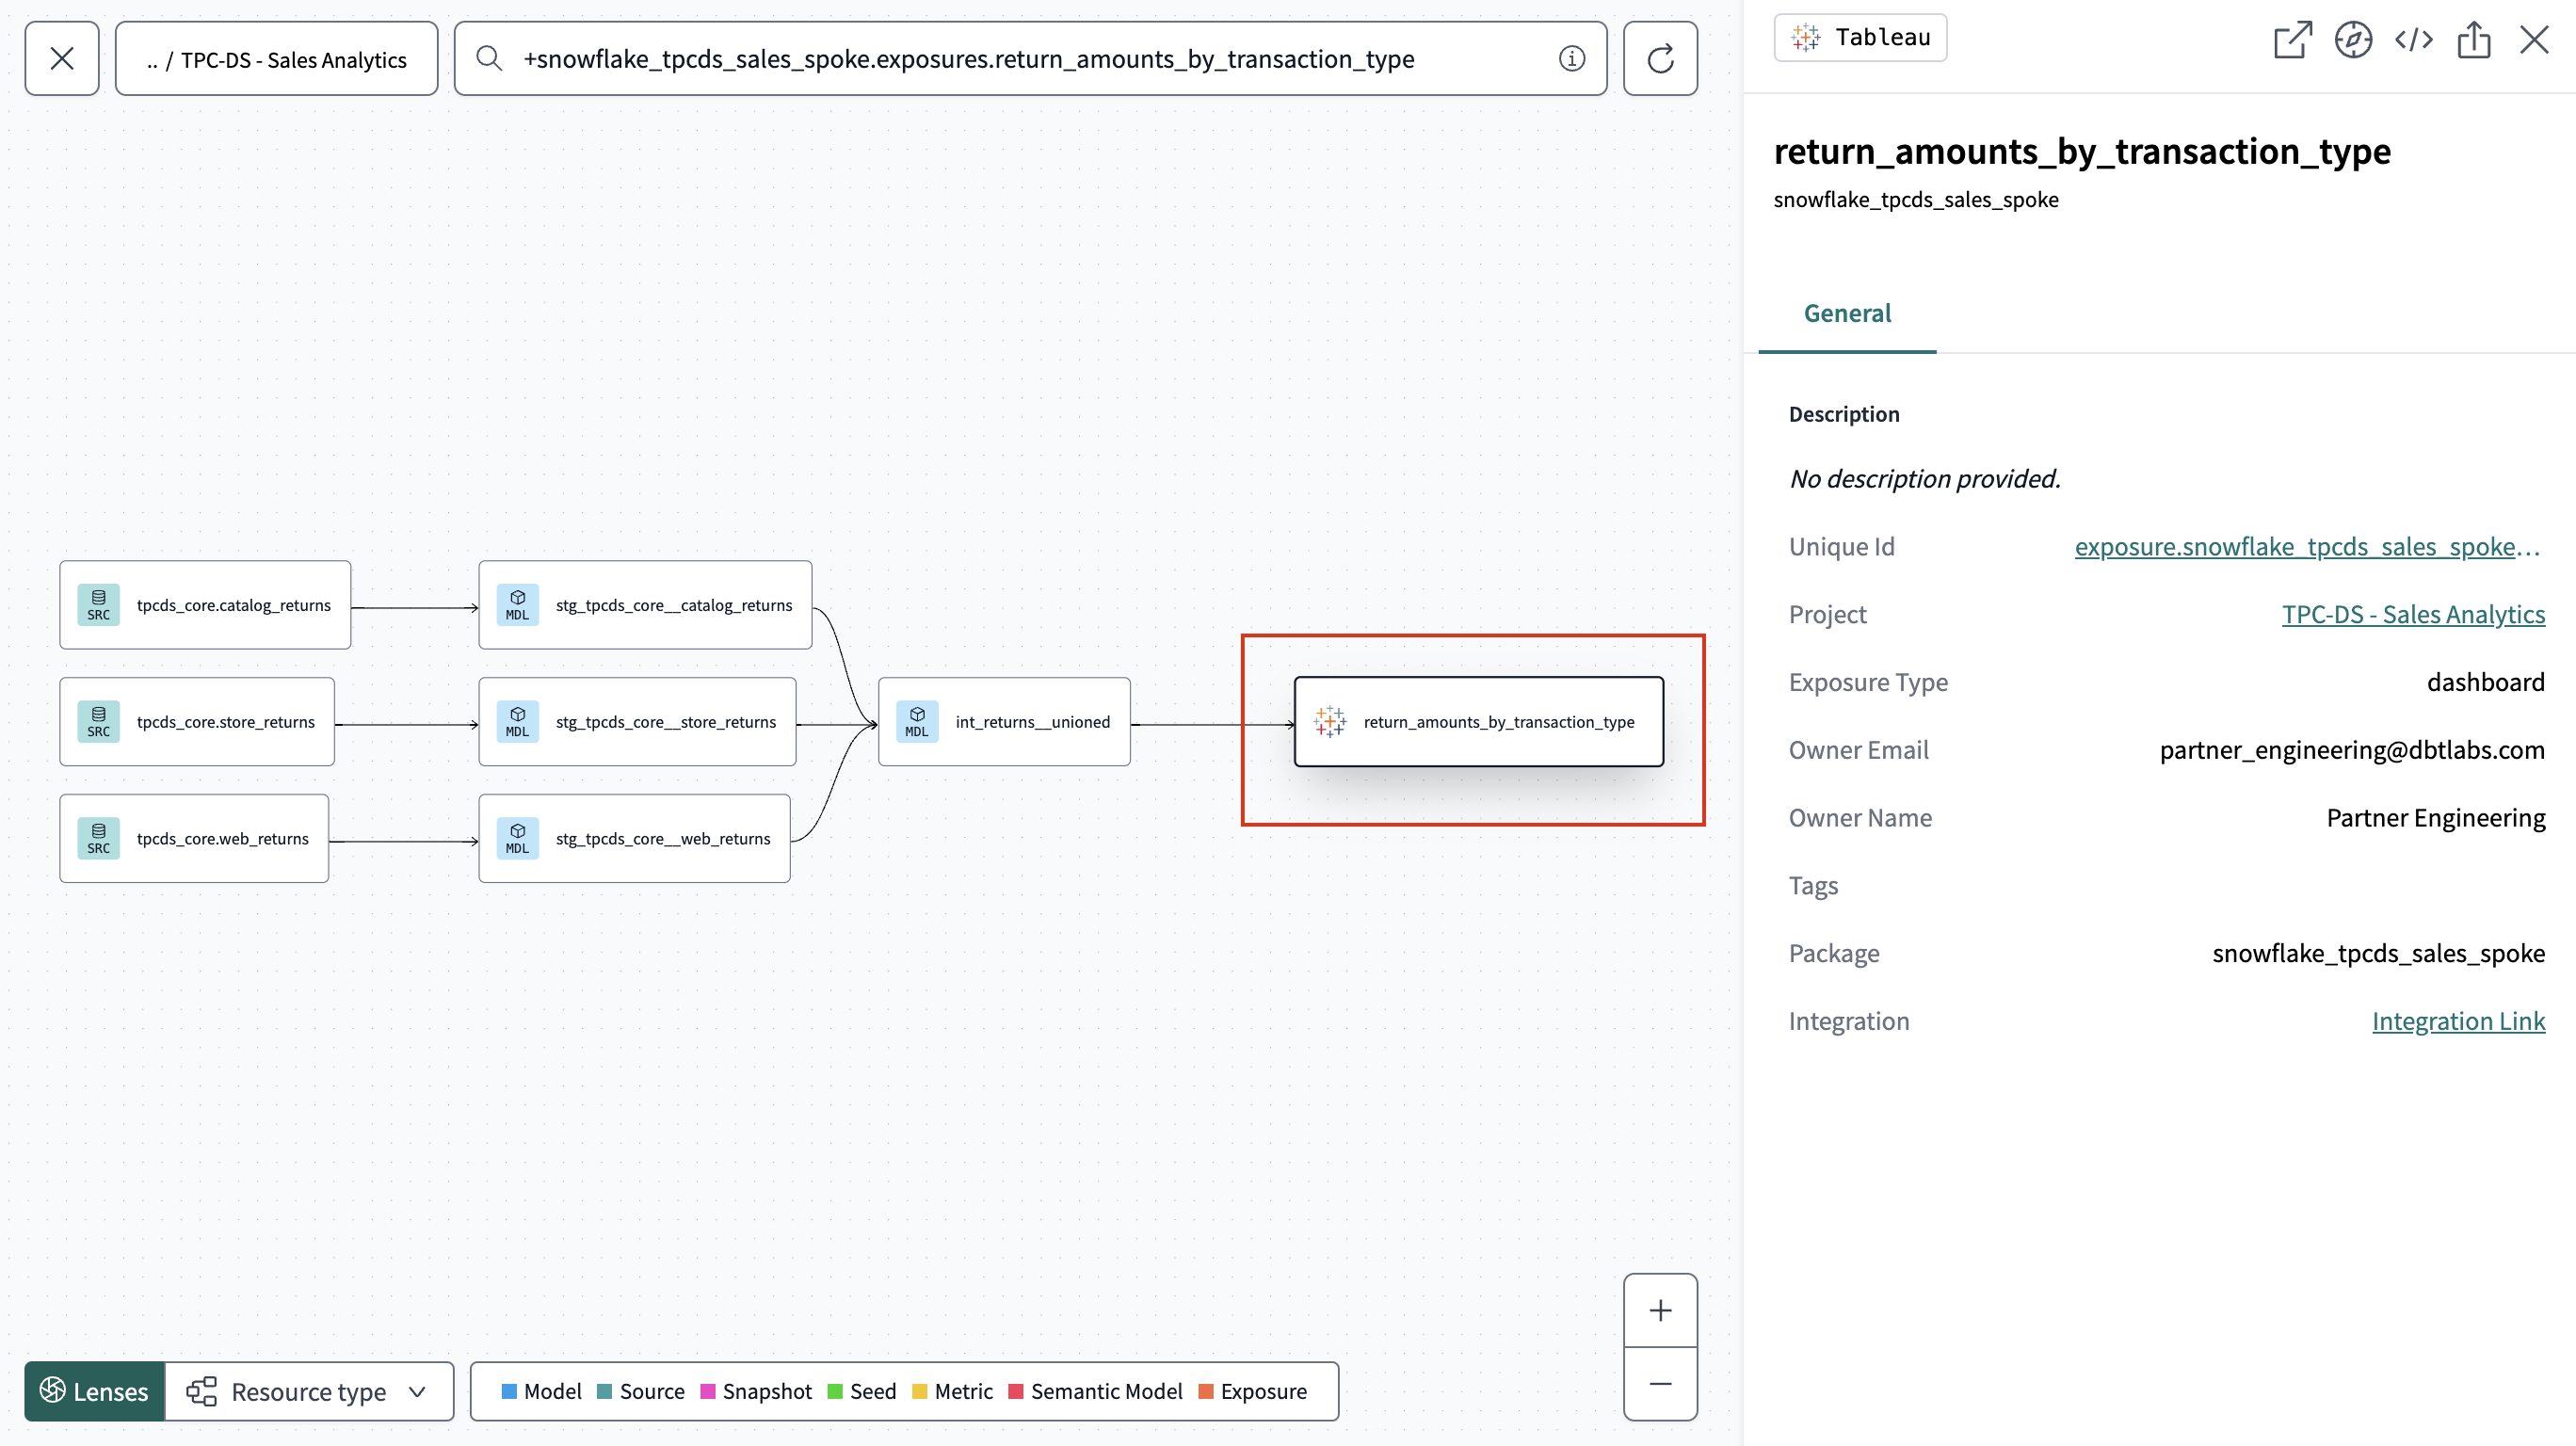
- Visualize downstream exposures — Set up and visualize downstream exposures to automatically expose relevant data models from Tableau to enhance visibility.
- Data health signals — View the data-health-signals for each resource to understand its health and performance.
Catalog permissions
When using global navigation and searching across your projects, the following permissions apply.
- Your project access permissions determine which dbt projects appear in the left-hand menu of the global navigation.
- In Catalog searches, we use soft access controls, you'll see all matching resources in search results, with clear indicators for items you don't have access to.
- For external metadata, the global platform credential controls which resources metadata users can discover. See External metadata ingestion for more details.
Availability by plan
Catalog is available on all Starter, Enterprise, and Enterprise+ plans. However, certain features are only available on Enterprise and Enterprise+ plans:
| Loading table... |
If you enjoy video courses, check out our dbt Catalog on-demand course and learn how to best explore your dbt project(s)!
Explore your project's lineage graph
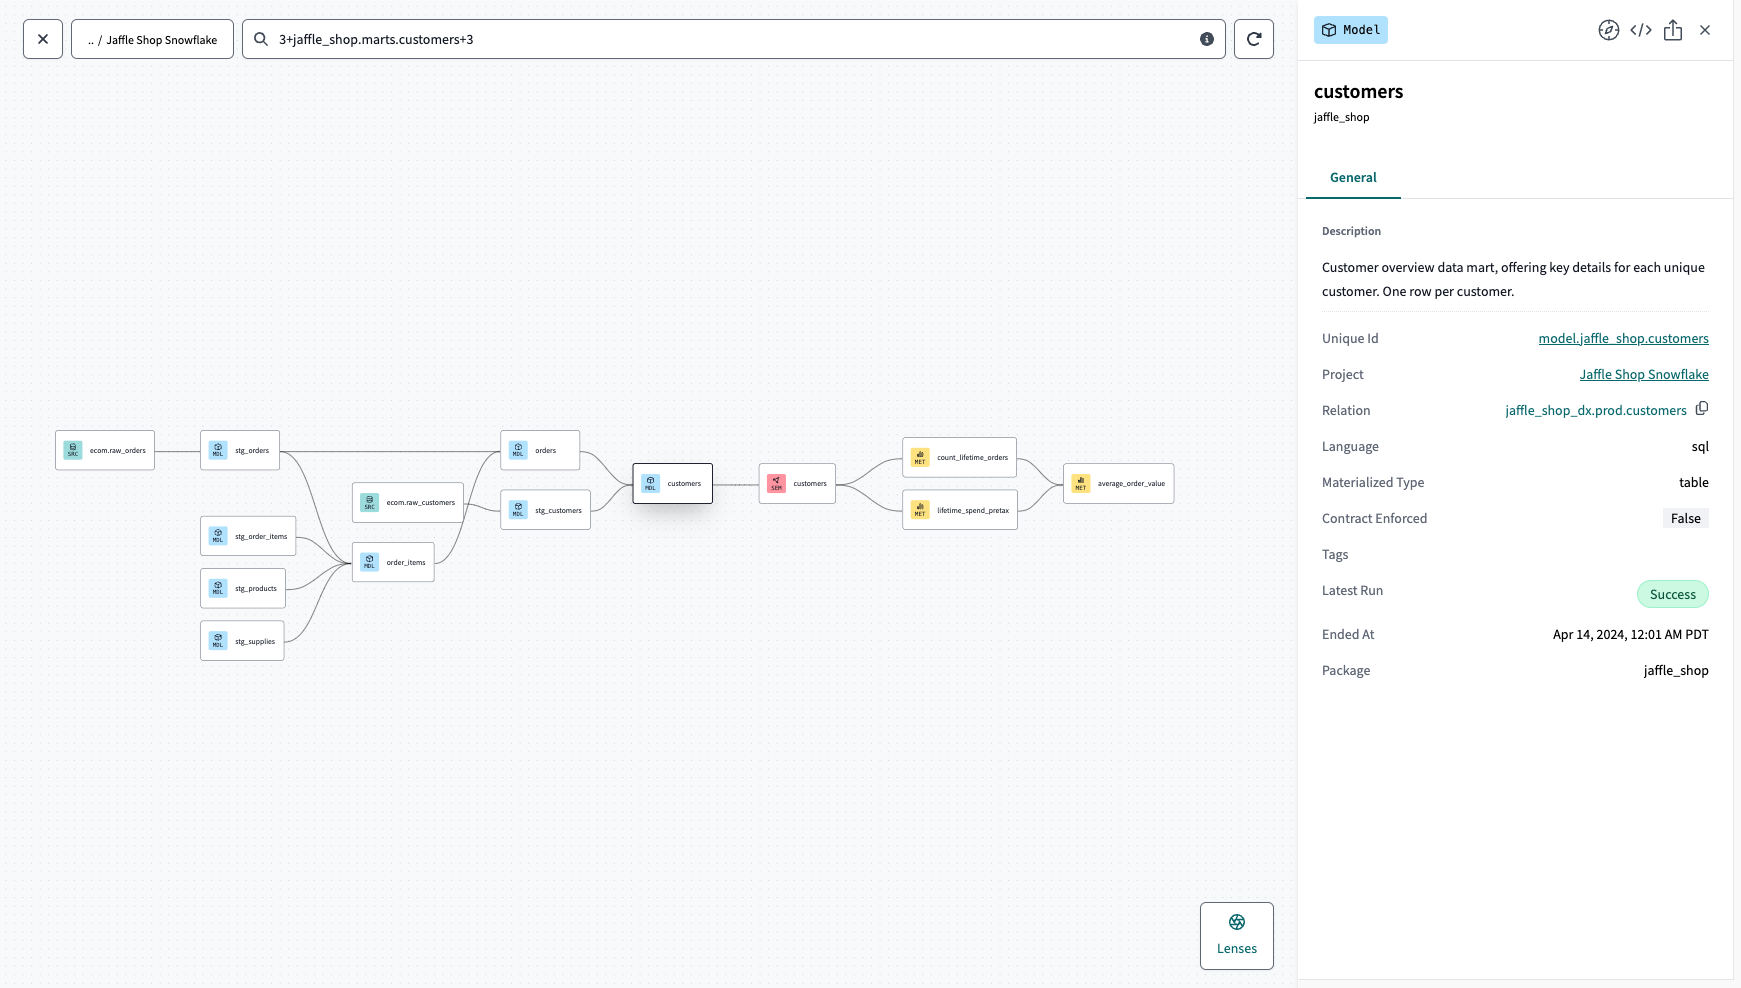
Catalog provides a visualization of your project's DAG that you can interact with. To access the project's full lineage graph, select Overview in the left sidebar and click the Explore Lineage button on the main (center) section of the page.
If you don't see the project lineage graph immediately, click Render Lineage. It can take some time for the graph to render depending on the size of your project and your computer's available memory. The graph of very large projects might not render so you can select a subset of nodes by using selectors, instead.
The nodes in the lineage graph represent the project's resources and the edges represent the relationships between the nodes. Nodes are color-coded and include iconography according to their resource type.
By default, Catalog shows the project's applied state lineage. That is, it shows models that have been successfully built and are available to query, not just the models defined in the project.
To explore the lineage graphs of tests and macros, view their resource details pages. By default, Catalog excludes these resources from the full lineage graph unless a search query returns them as results.
Example of full lineage graph
Example of exploring a model in the project's lineage graph:
Explore your project's ERD view Alpha
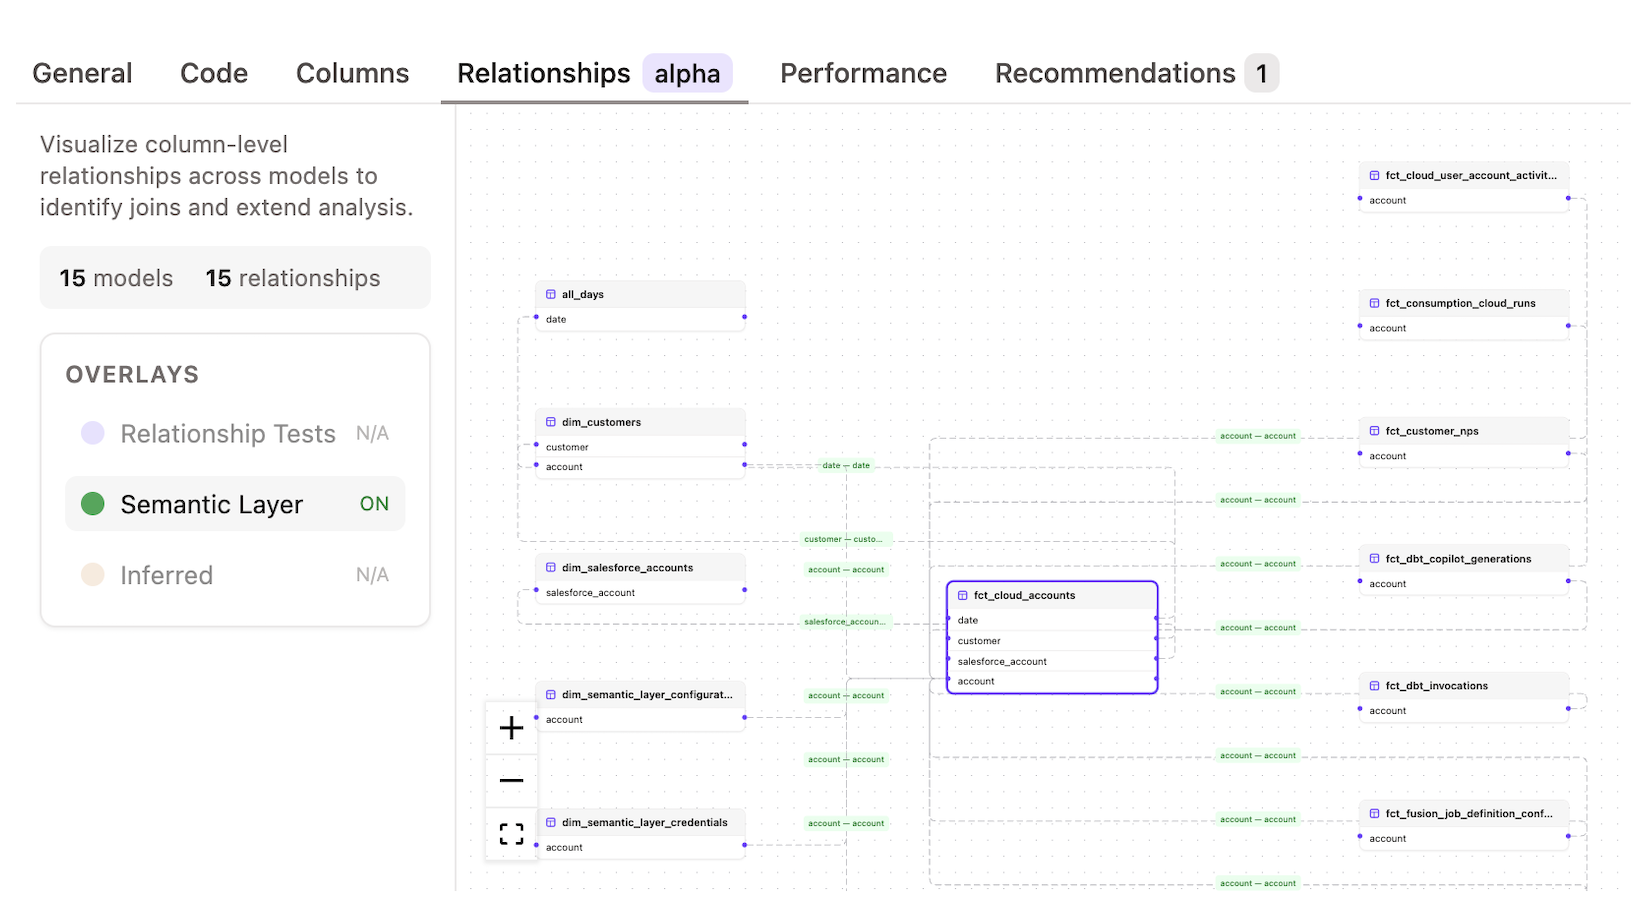
Entity relationship diagrams (ERD) in Catalog help you understand how models relate structurally. This includes which models can be joined and which keys connect them. ERD complements lineage by showing relationship paths for analysis, not only transformation dependencies.
ERD is currently in alpha and is enabled for selected customer accounts. To request access for your account, contact your account manager.
To access ERD in Catalog:
- Navigate to Catalog in the top-level navigation.
- Select a model.
- Open the Relationships tab (marked alpha) on the model's resource details page to access ERD.
Why ERD is useful
When you explore an unfamiliar part of your business data (for example, orders, customers, or subscriptions), you often need to answer questions like which dimensions you can access when you join models.
Without ERD, you may need to inspect schema files manually, run local tooling, or ask teammates. ERD brings this context into Catalog so you can investigate faster in dbt platform.
ERD versus lineage
ERD and lineage answer different questions:
- Lineage (DAG) shows how data is built, that is, the transformation dependencies between resources.
- ERD shows how data is related for analysis, that is, which models can be joined and which keys connect them.
Use lineage to understand build flow. Use ERD to understand join paths.
How ERD determines relationships
In Catalog, ERD builds model connections using metadata from your dbt project. This includes relationship tests, model contracts, and Semantic Layer entities.
If ERD cannot find enough explicit relationship metadata, it can also suggest likely model connections based on available dbt context.
Because ERD relies on dbt metadata, relationships defined only in your warehouse might not appear unless that relationship metadata is also represented in data that Catalog uses.
ERD supports multiple overlays so you can compare explicit and suggested connections:
- Relationship tests: Relationships defined in
schema.ymltests. - Semantic Layer entities: Relationships inferred from MetricFlow entity definitions, such as primary and foreign entity matches.
- Foreign key (FK) constraints: Relationships derived from foreign key constraints in model contracts.
- Heuristic inferred: Candidate relationships inferred from
_idnaming patterns and scored by confidence.
Understanding summary and overlay state
Each overlay uses a distinct visual style and color in the ERD canvas so you can quickly identify relationship sources.
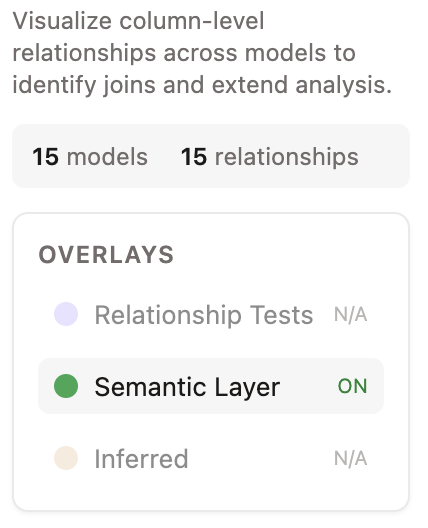
The relationships summary panel shows relationship totals, model count, and a per-type breakdown for the current graph scope.
Overlay controls reflect availability:
- If a relationship type exists in the current scope, you can toggle it on or off.
- If no connections of that type exist, the toggle is disabled and marked as unavailable in the current view.
Confidence and review for inferred relationships
Relationship tests and FK constraints are stronger signals because they are defined directly in your project.
When explicit relationship metadata is limited, ERD suggests additional relationships to support discovery. For heuristic suggestions, you can:
- Inspect confidence and supporting evidence.
- Review a generated YAML snippet.
- Approve or dismiss individual suggestions.
- Approve all high-confidence suggestions in bulk.
What you can do in ERD
In an ERD, you can:
- Navigate with zoom, pan, and minimap.
- Filter by schema or domain scope.
- Search and highlight matching models.
- Click any edge type to inspect relationship details.
- Open a model details panel for metadata, columns, and relationships.
- Set a model as focus to recenter the graph on that model and its one-hop neighbors.
Consideration
Use ERD for testing and exploration only. Because the feature is still maturing, behavior and interfaces may change, including potentially breaking changes.
Lenses
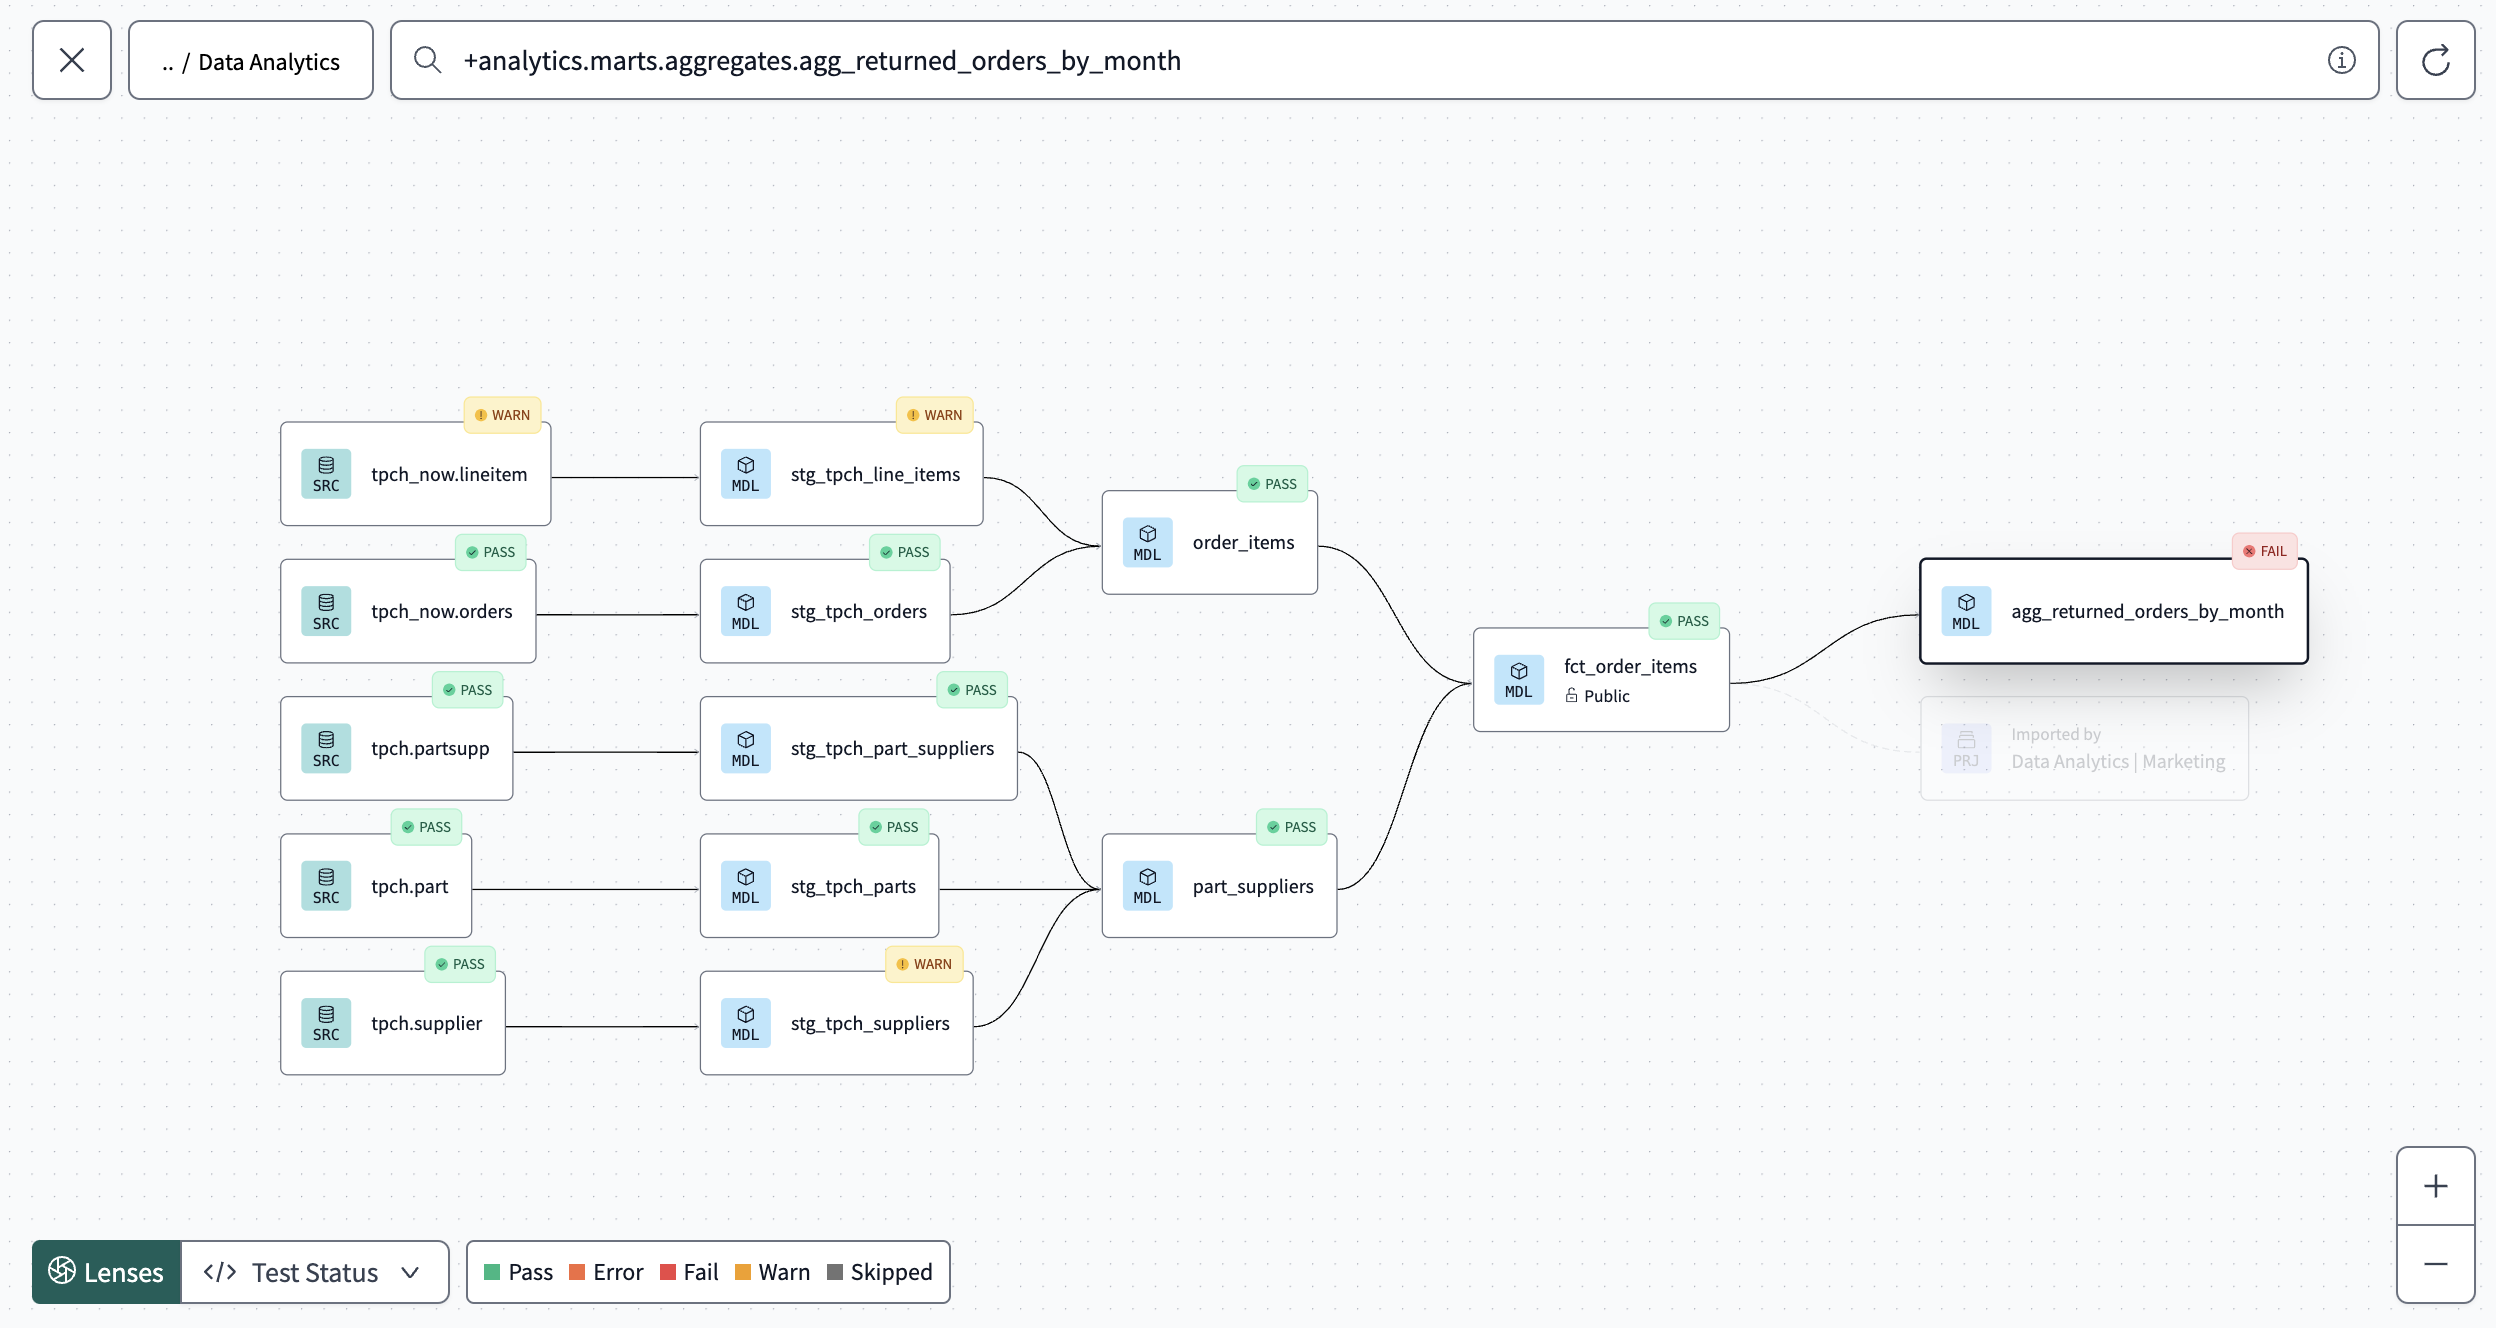
The Lenses feature is available from your project's lineage graph (lower right corner). Lenses are like map layers for your DAG. Lenses make it easier to understand your project's contextual metadata at scale, especially to distinguish a particular model or a subset of models.
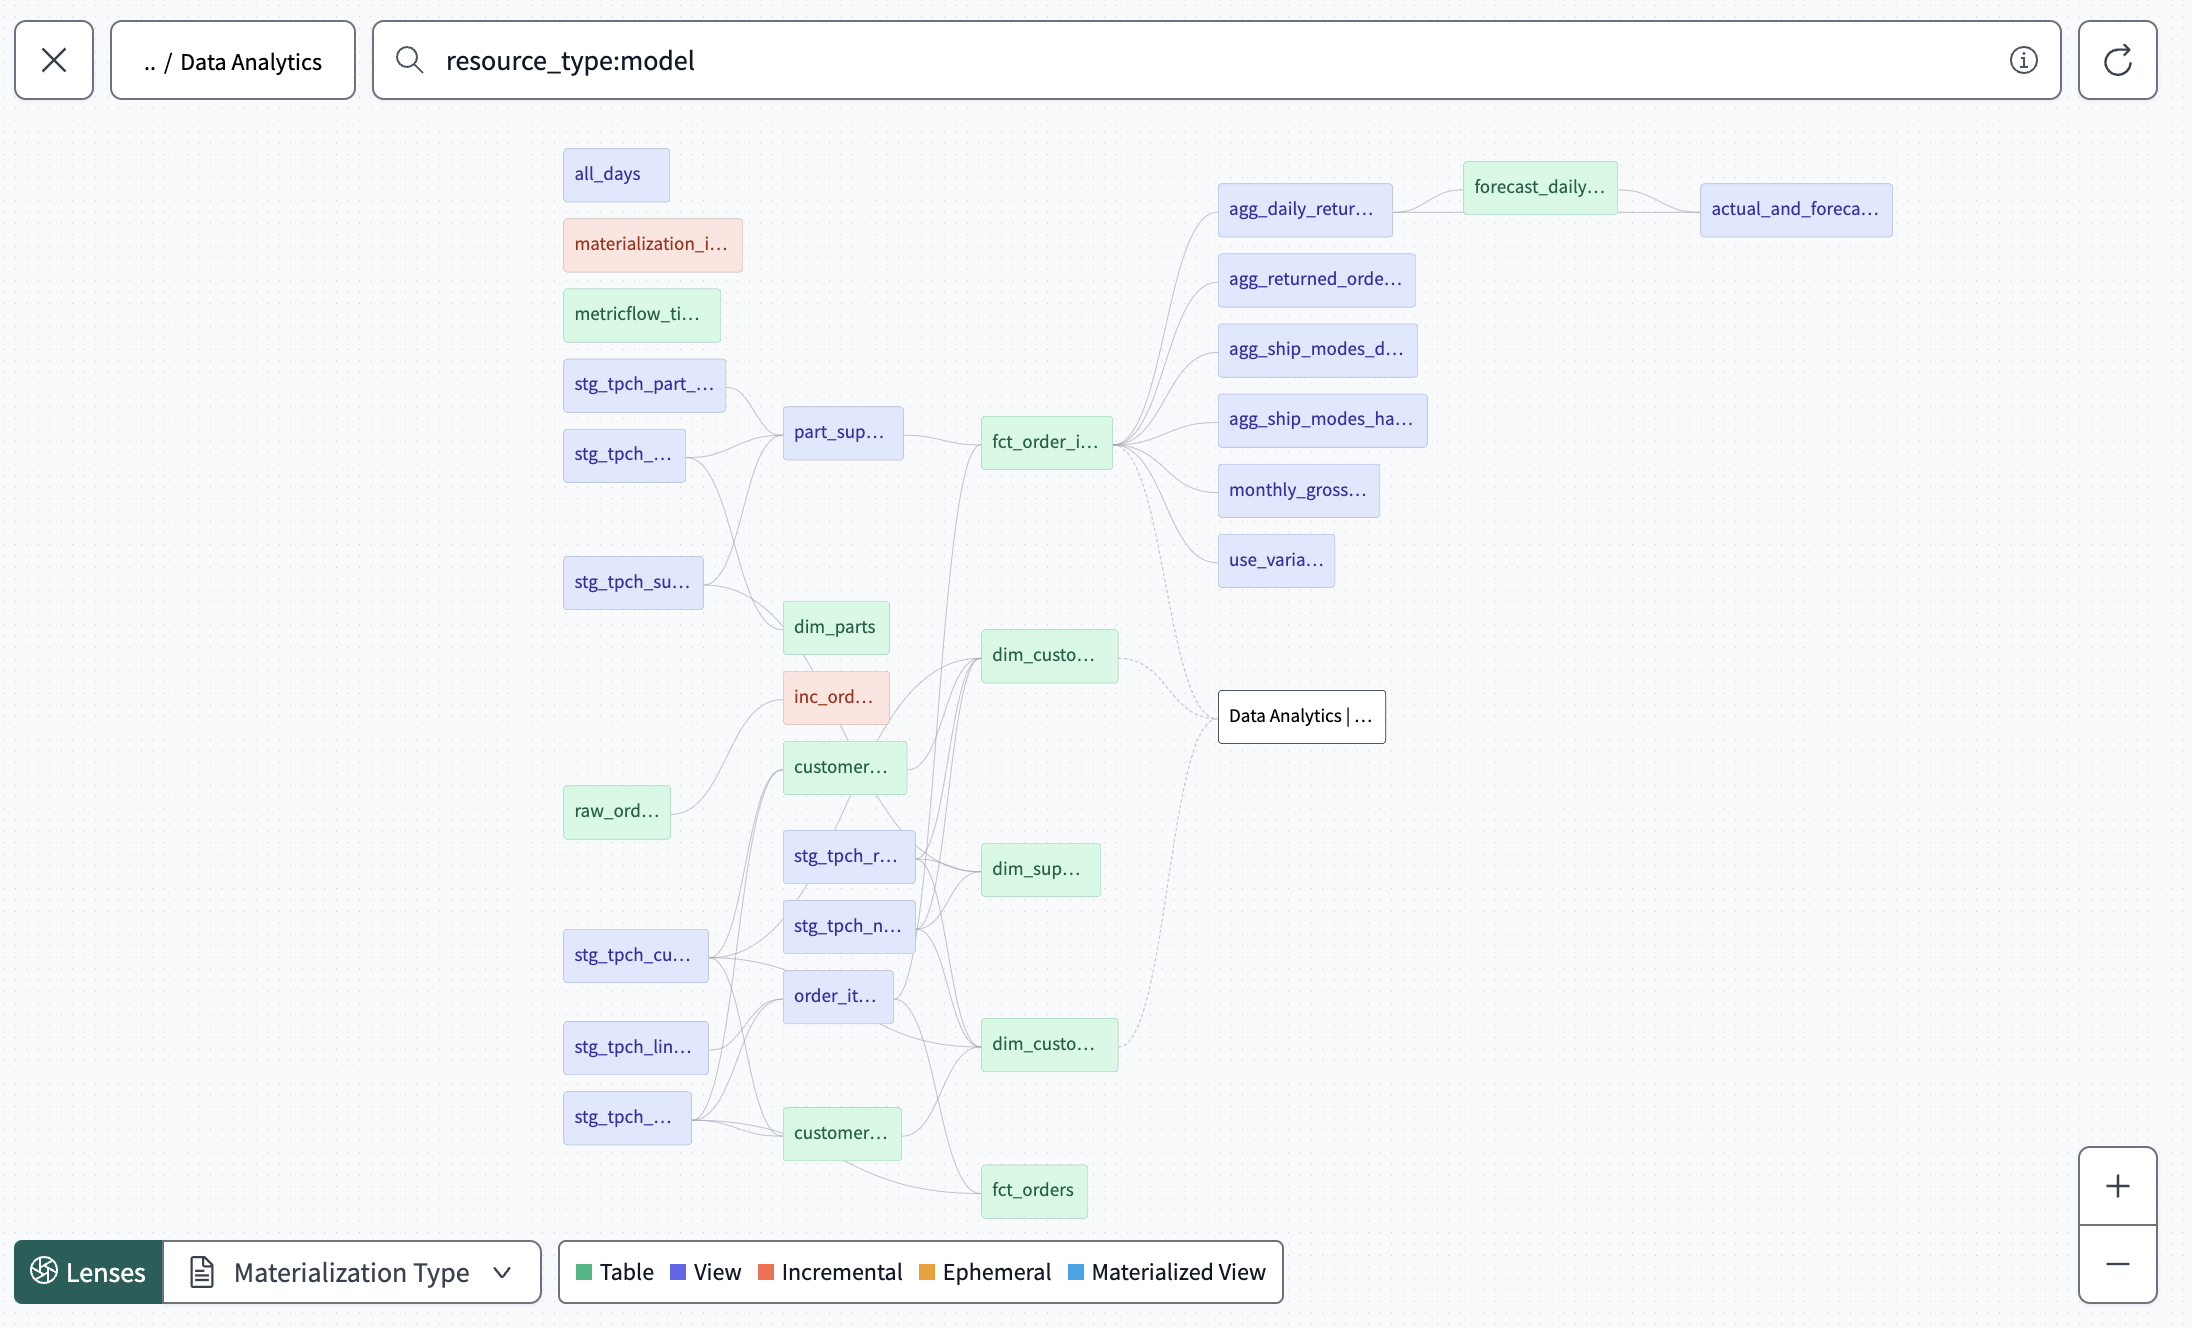
When you apply a lens, tags become visible on the nodes in the lineage graph, indicating the layer value along with coloration based on that value. If you're significantly zoomed out, only the tags and their colors are visible in the graph.
Lenses are helpful to analyze a subset of the DAG if you're zoomed in, or to find models/issues from a larger vantage point.
Example of lenses
Example of applying the Materialization type lens with the lineage graph zoomed out. In this view, each model name has a color according to the materialization type legend at the bottom, which specifies the materialization type. This color-coding helps to quickly identify the materialization types of different models.
Example of applying the Tests Status lens, where each model name displays the tests status according to the legend at the bottom, which specifies the test status.
Keyword search
With Catalog, global navigation provides a search experience allowing you to find dbt resources across all your projects, as well as non-dbt resources in Snowflake.
You can locate resources in your project by performing a keyword search in the search bar. All resource names, column names, resource descriptions, warehouse relations, and code matching your search criteria will be displayed as a list on the main (center) section of the page. When searching for an exact column name, the results show all relational nodes containing that column in their schemas. If there's a match, a notice in the search result indicates the resource contains the specified column. Also, you can apply filters to further refine your search results.
Example of keyword search
Example of results from searching on the keyword customers and applying the filters models, description, and code. Data health signals are visible to the right of the model name in the search results.
Browse with the sidebar
From the sidebar, you can browse your project's resources, its file tree, and the database.
- Resources tab — All resources in the project organized by type. Select any resource type in the list and all those resources in the project will display as a table in the main section of the page. For a description on the different resource types (like models, metrics, and so on), refer to About dbt projects.
- Data health signals are visible to the right of the resource name under the Health column.
- File Tree tab — All resources in the project organized by the file in which they are defined. This mirrors the file tree in your dbt project repository.
- Database tab — All resources in the project organized by the database and schema in which they are built. This mirrors your data platform's structure that represents the applied state of your project.
Integrated tool access
Users with a developer license or an analyst seat* can open a resource directly from the Catalog in the Studio IDE to view its model files, in Insights to query it, or in Canvas for visual editing.
* The Analyst license type is not available for new purchase.
View model versions
If models in the project are versioned, you can see which version of the model is being applied — prerelease, latest, and old — in the title of the model's details page and in the model list from the sidebar.
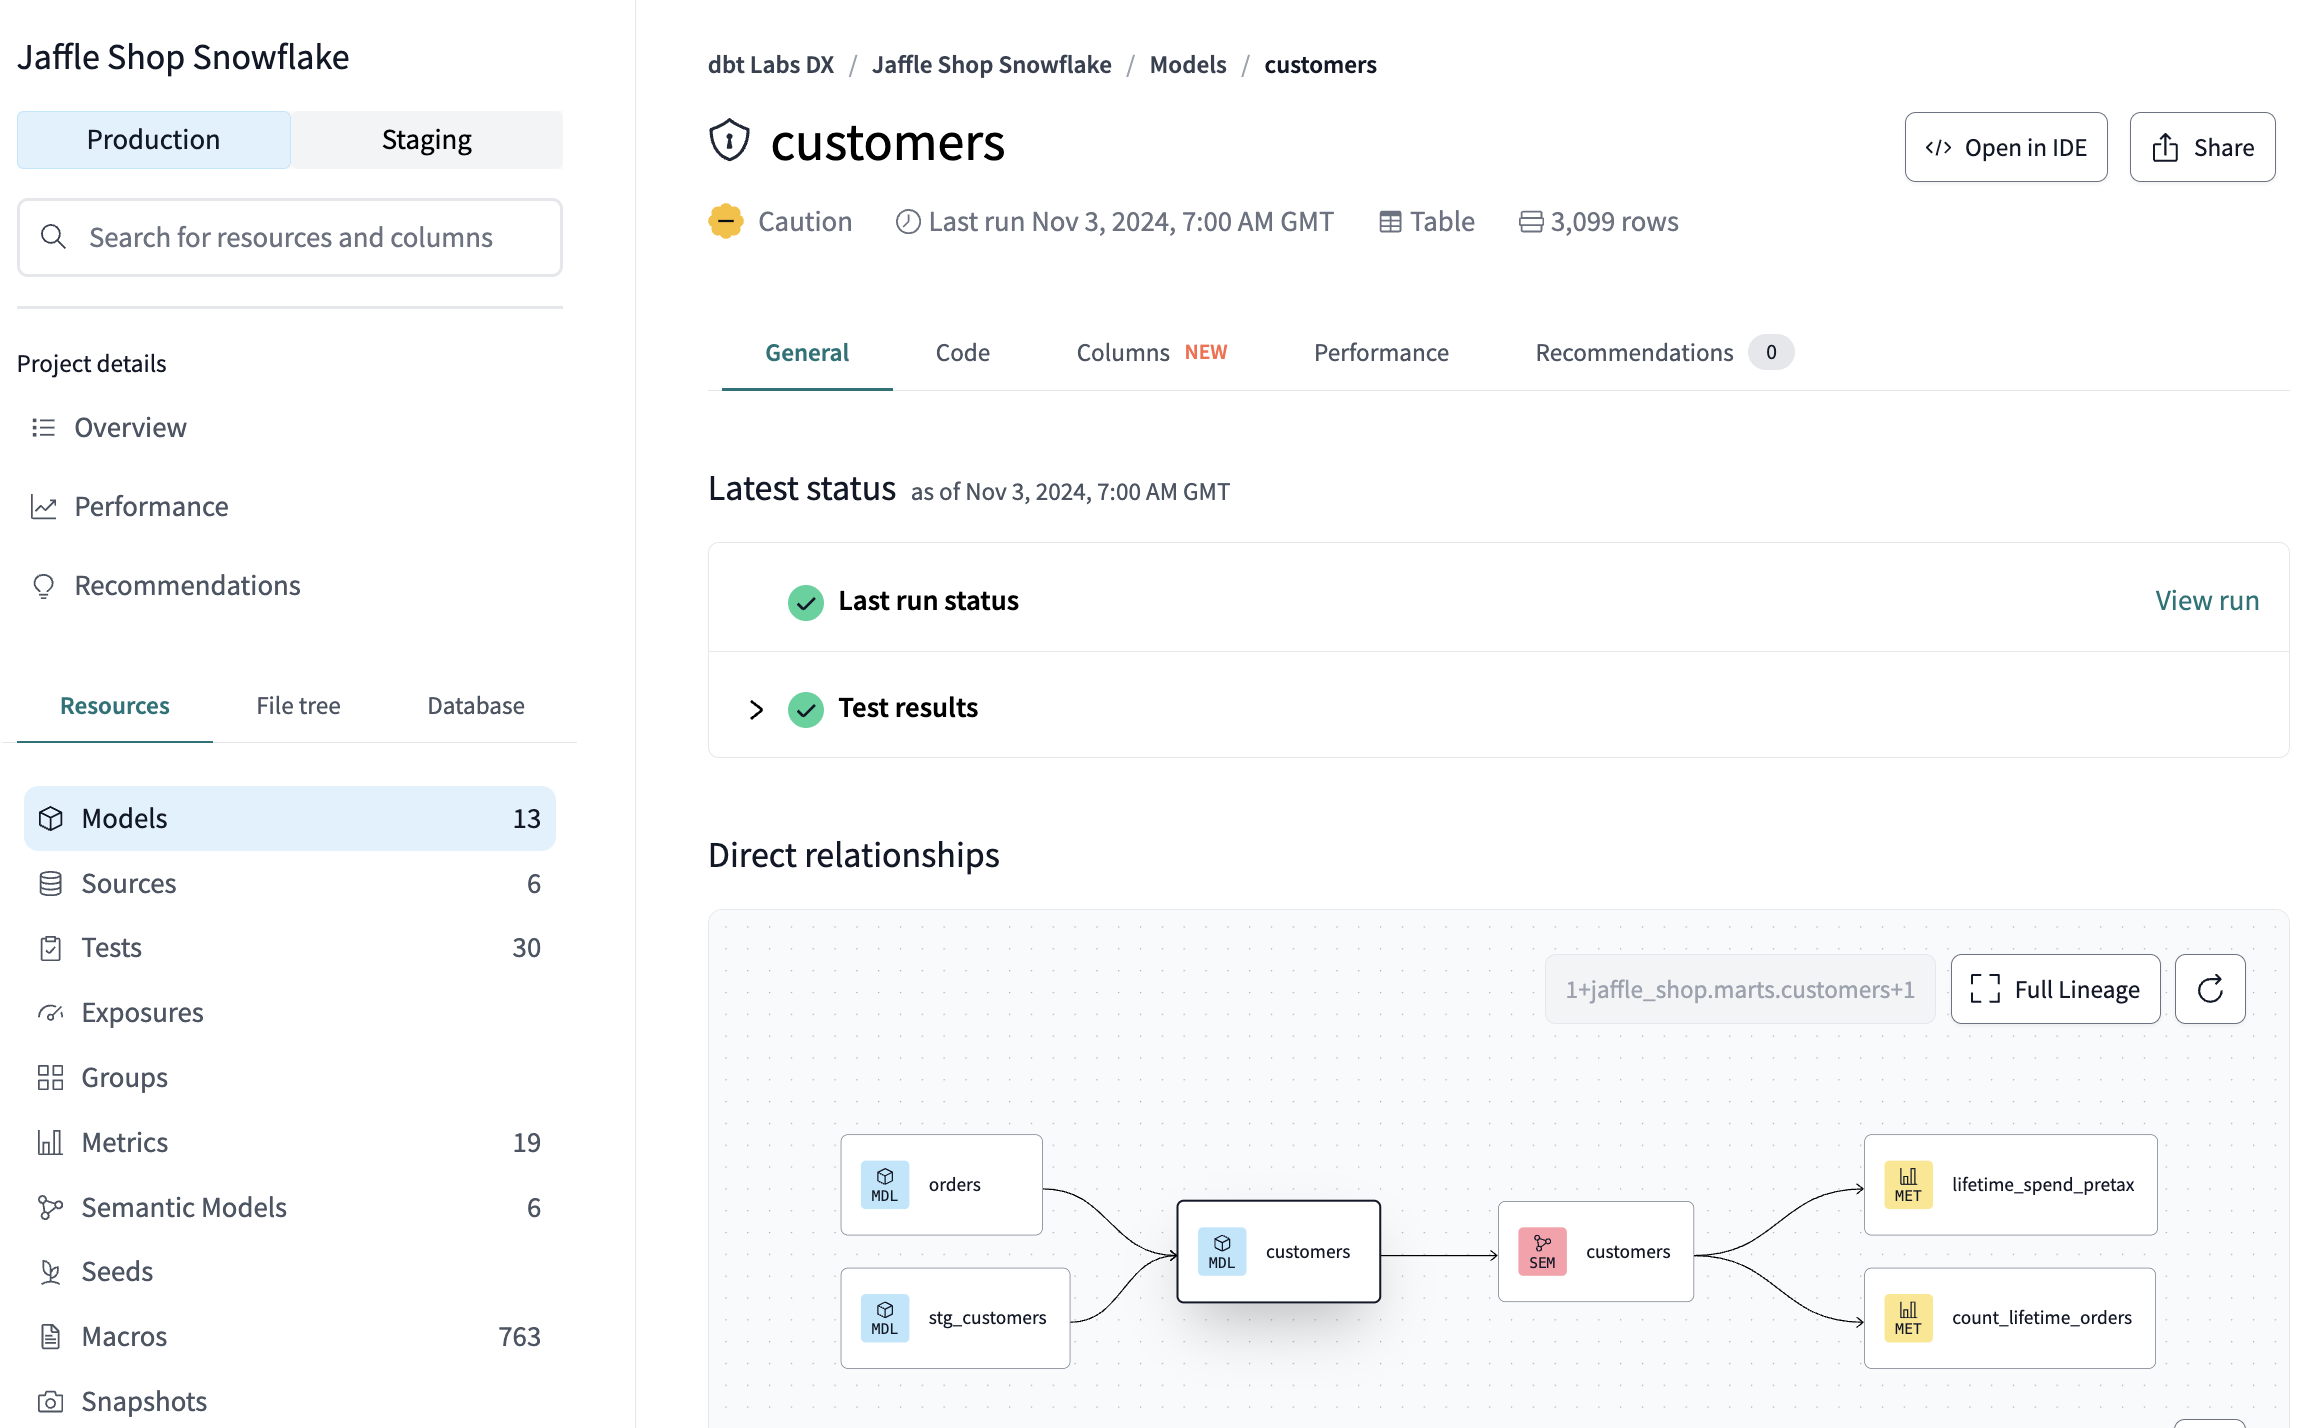
View resource details
You can view the definition and latest run results of any resource in your project. To find a resource and view its details, you can interact with the lineage graph, use search, or browse the Catalog.
The details (metadata) available to you depends on the resource's type, its definition, and the commands that run within jobs in the production environment.
In the upper right corner of the resource details page, you can:
- Click the Open in Studio IDE icon to examine the resource using the Studio IDE.
- Click the Share icon to copy the page's link to your clipboard.
Example of model details
Staging environment
Catalog supports views for staging deployment environments, in addition to the production environment. This gives you a unique view into your pre-production data workflows, with the same tools available in production, while providing an extra layer of scrutiny.
You can explore the metadata from your production or staging environment to inform your data development lifecycle. Just set a single environment per dbt project as "production" or "staging," and ensure the proper metadata has been generated then you'll be able to view it in Catalog. Refer to Generating metadata for more details.
Related content
Was this page helpful?
This site is protected by reCAPTCHA and the Google Privacy Policy and Terms of Service apply.
