Model performance EnterpriseEnterprise +
Catalog provides metadata on dbt runs for in-depth model performance and quality analysis. This feature assists in reducing infrastructure costs and saving time for data teams by highlighting where to fine-tune projects and deployments — such as model refactoring or job configuration adjustments.
If you enjoy video courses, check out our dbt Catalog on-demand course and learn how to best explore your dbt project(s)!
The Performance overview page
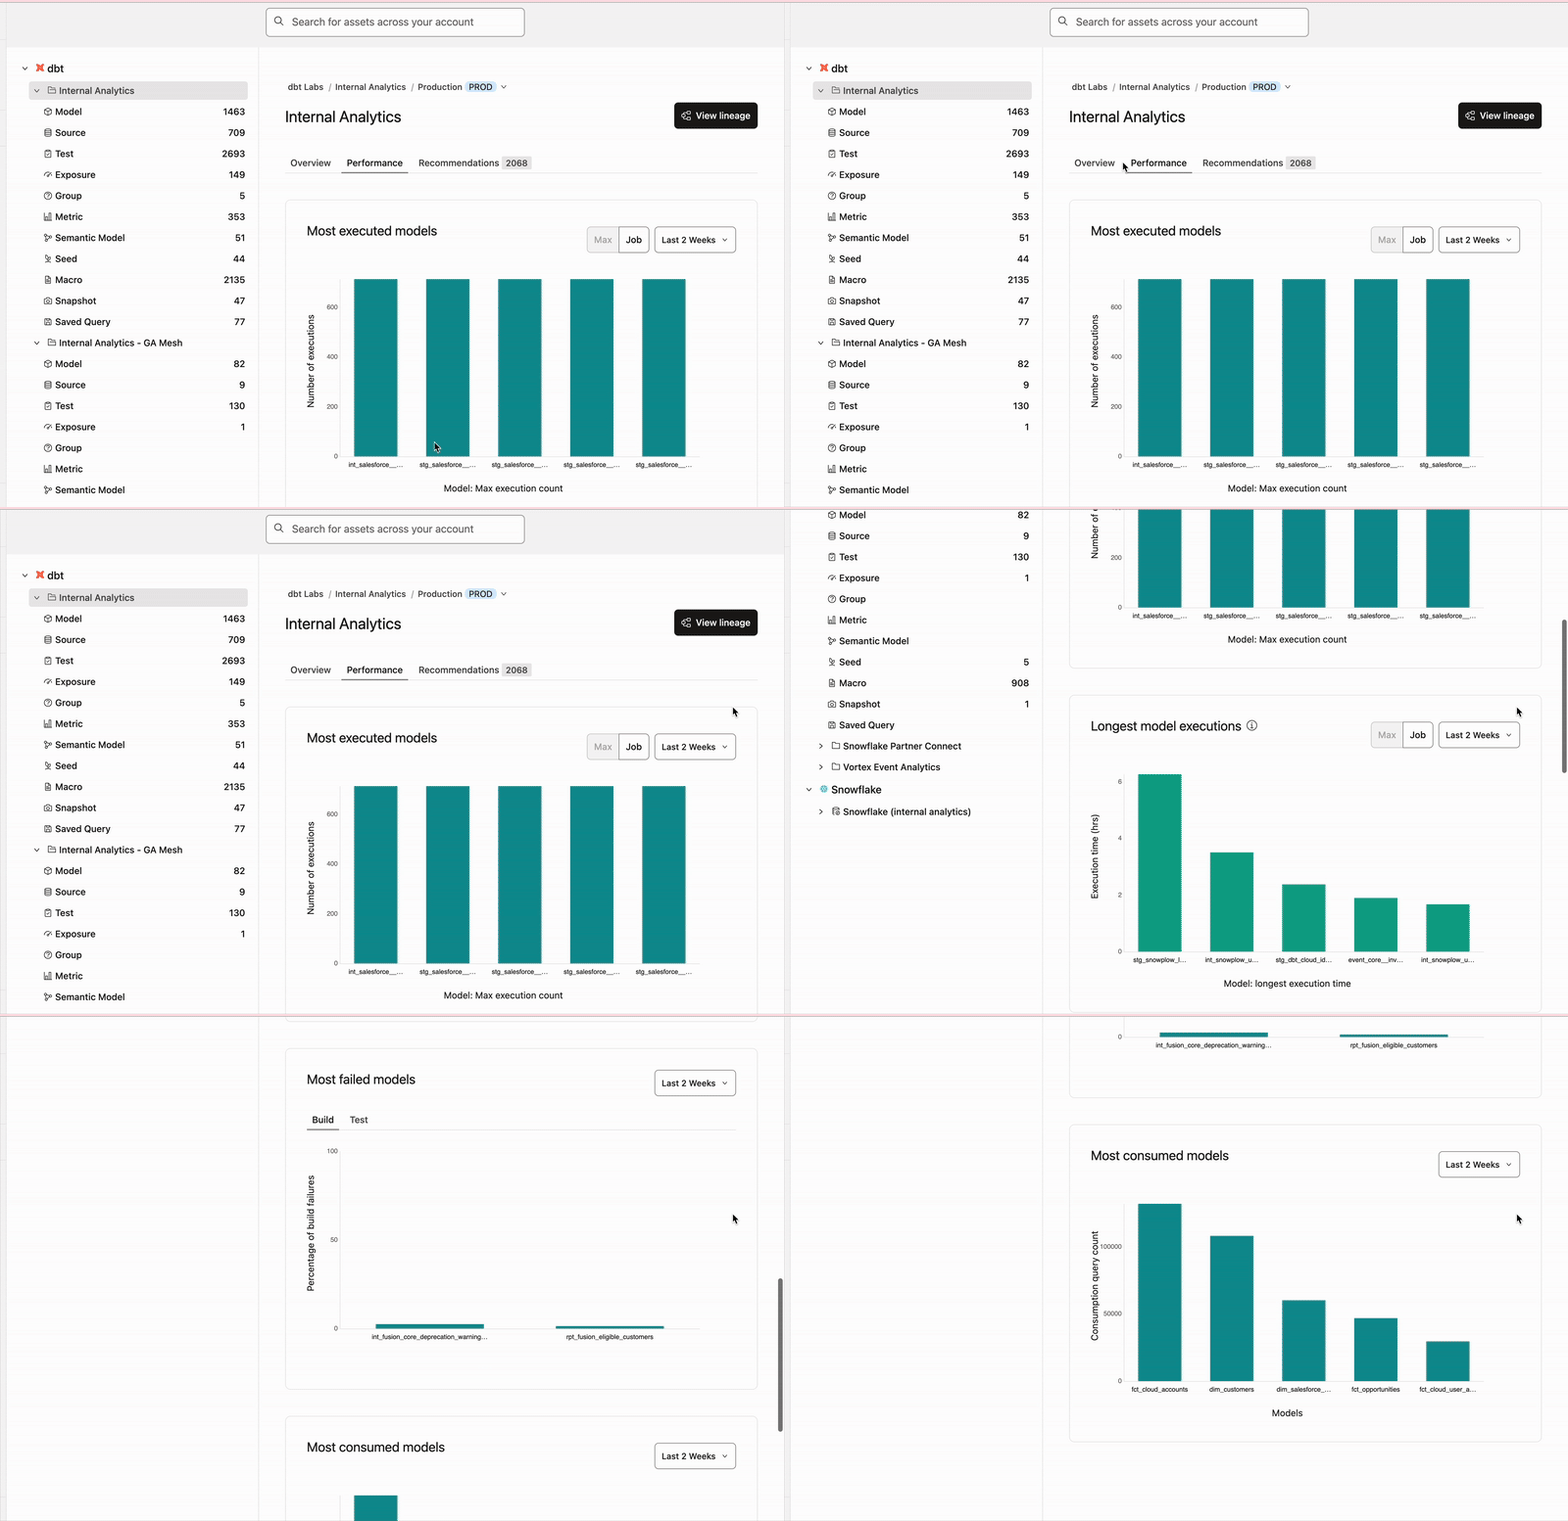
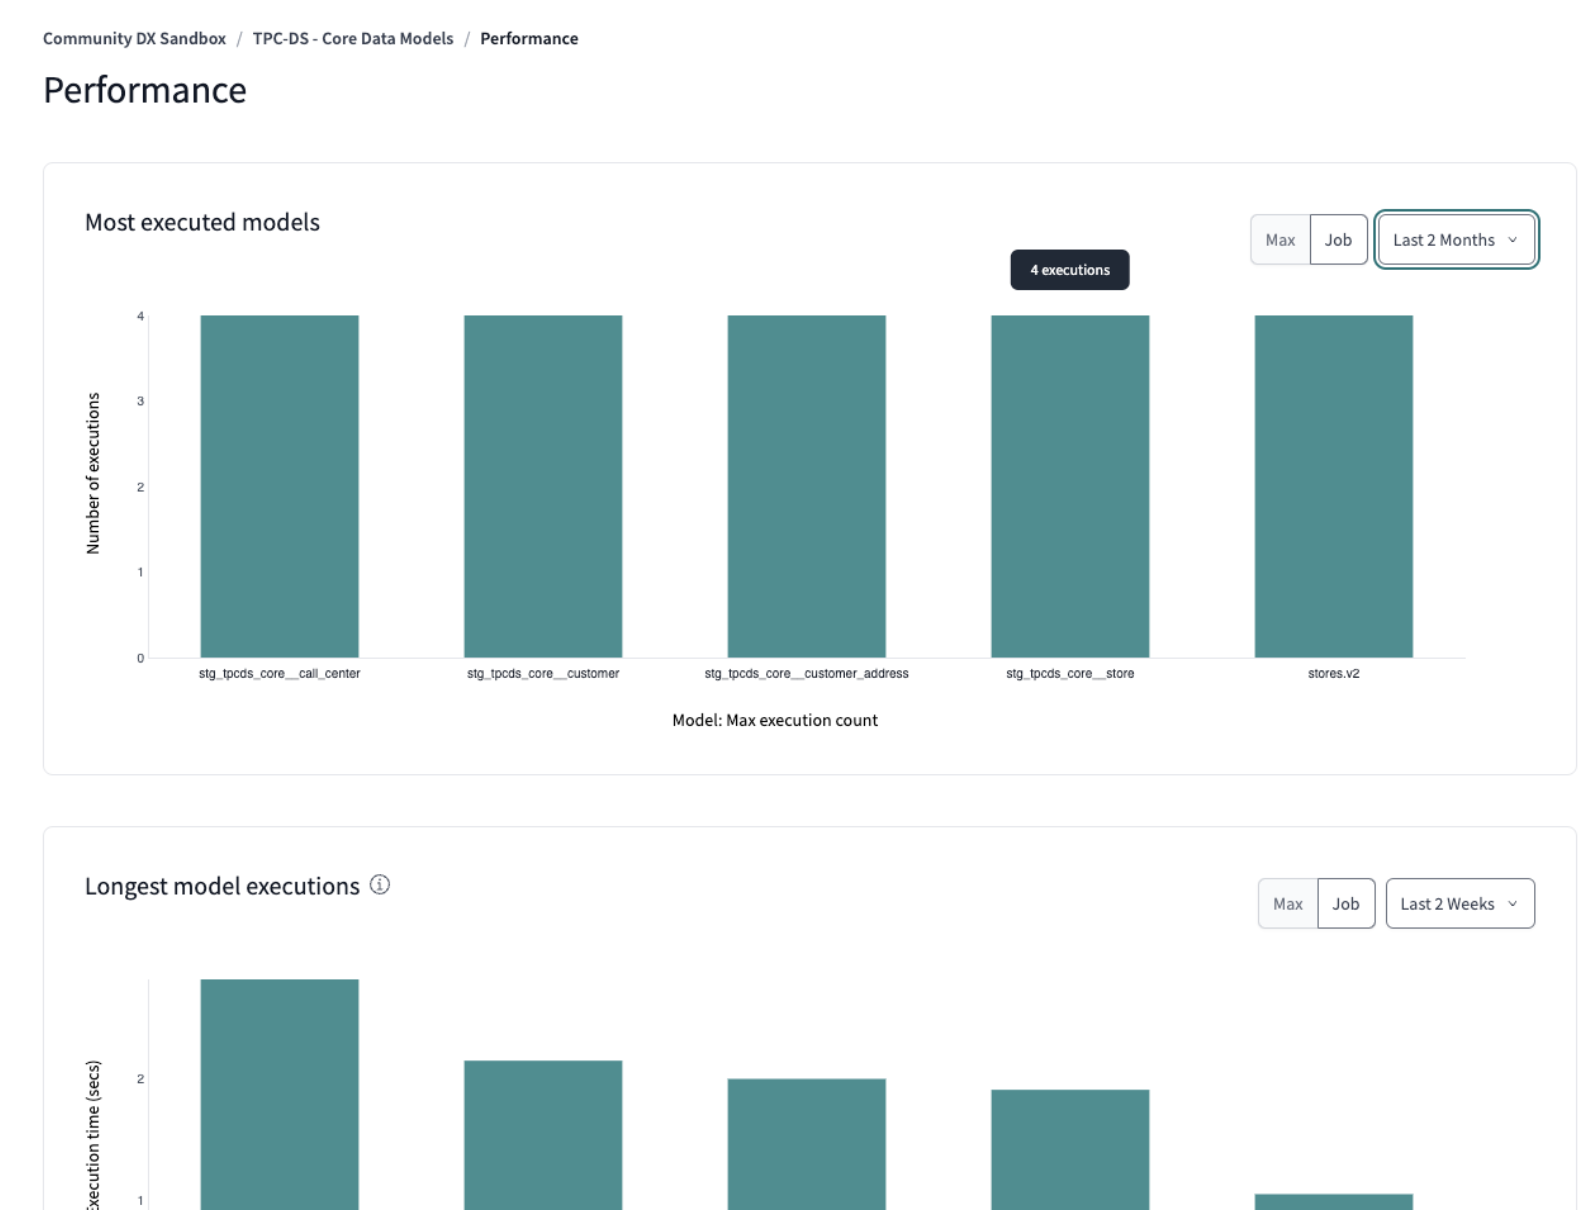
You can pinpoint areas for performance enhancement by using the Performance overview page. This page presents a comprehensive analysis across all project models and displays the longest-running models, those most frequently executed, and the ones with the highest failure rates during runs/tests. Data can be segmented by environment and job type which can offer insights into:
- Most executed models (total count).
- Models with the longest execution time (average duration).
- Models with the most failures, detailing run failures (percentage and count) and test failures (percentage and count).
Each data point links to individual models in Catalog.
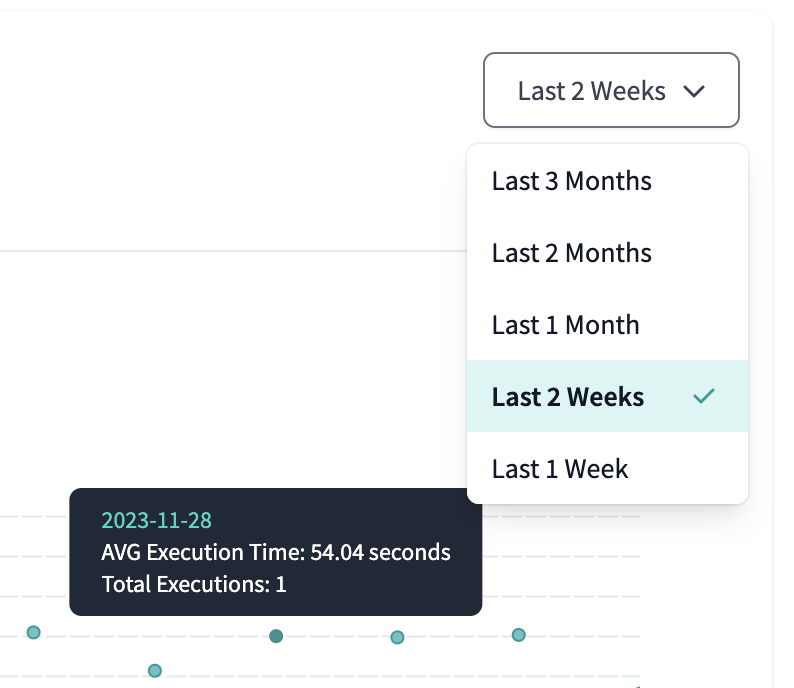
You can view historical metadata for up to the past three months. Select the time horizon using the filter, which defaults to a two-week lookback.
The Model performance tab
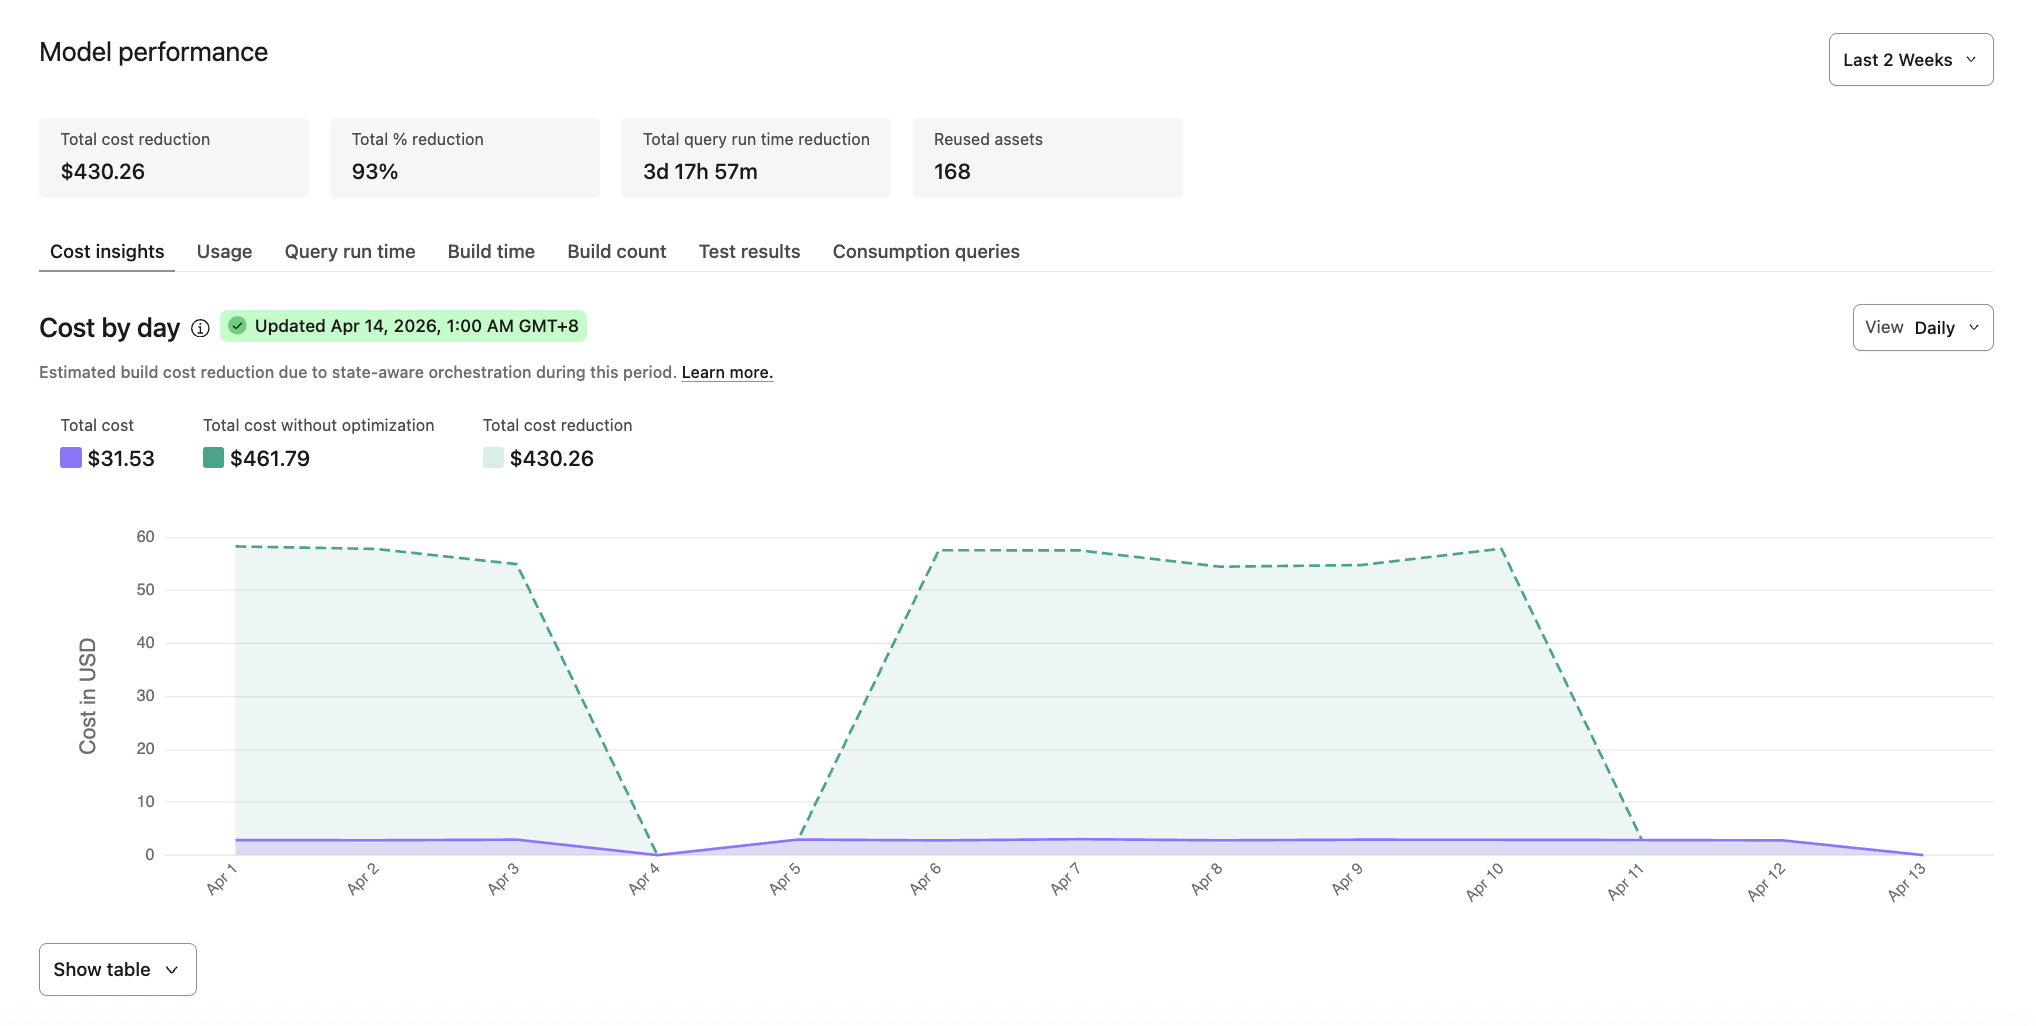
The Model performance section in Catalog displays historical trends to help you identify optimization opportunities and understand model resource consumption.
Key metrics
The Model performance section displays the following metrics that summarize the overall cost and optimization impact for your project:
- Total cost reduction
- Total % reduction
- Total query run time deduction
- Reused assets (when state-aware orchestration is enabled)
Filters
Use the time period filter to customize the data you want to view: from the last 3 months up to the last 1 week.
For Cost insights, Usage, and Query run time tabs, you can set the view granularity by Daily, Weekly, or Monthly.
Visualization tabs
- Cost insights: Shows the estimated warehouse costs incurred by this model and cost reduction from state-aware orchestration.
- Usage: Shows the estimated warehouse usage consumed by this model over time. The Usage tab represents generic usage for your warehouse. The specific unit depends on your data warehouse:
- Snowflake: Credits
- BigQuery: Slot hours or bytes scanned (currently combined into one generic usage number)
- Databricks: Databricks Units (DBUs)
- Query run time: Shows the estimated query execution time and the reduction in run duration from state-aware orchestration.
- Build time: Shows average execution time for the model and how it trends over the selected period.
- Build count: Tracks how many times the model was built or reused, including any failures or errors.
- Test results: Displays test execution outcomes and pass/fail rates for tests on this model.
- Consumption queries: Shows queries running against this model, helping you understand downstream usage patterns.
Table view
For Cost insights, Usage, and Query run time tabs, you can access the table view by clicking Show table, which provides detailed optimization data such as models reused, usage reduction, and cost reduction.
When viewing the table, you can export the data as a CSV file using the Download button.
Chart interactions
For Build time and Build count tabs:
- Click on any data point in the charts to see a detailed table listing all job runs for that day.
- Each row in the table provides a direct link to the run details if you want to investigate further.
Was this page helpful?
This site is protected by reCAPTCHA and the Google Privacy Policy and Terms of Service apply.


