Access Catalog from dbt platform features
Access Catalog from other features and products inside dbt, ensuring you have a seamless experience navigating between resources and lineage in your project.
This page explains how to access Catalog from various dbt features, including the Studio IDE and jobs. While the primary way to navigate to Catalog is by clicking Catalog in the navigation, you can also access it from other dbt features.
Studio IDE
You can enhance your project navigation and editing experience by directly accessing resources from the Studio IDE to Catalog for model, seed, or snapshot files. This workflow offers a seamless transition between the Studio IDE and Catalog, allowing you to quickly navigate between viewing project metadata and making updates to your models or other resources without switching contexts.
Access Catalog from the IDE
- In your model, seed, or snapshot file, click the View in Catalog icon to the right of your file breadcrumb (under the file name tab).
- This opens the model, seed, or snapshot file in a new tab, allowing you to view resources/lineage directly in Catalog.
 Access dbt Catalog from the IDE by clicking on the 'View in Explorer' icon next to the file breadcrumbs.
 Canvas
Seamlessly access Catalog via Canvas to bring your workflow to life with visual editing.
Access Catalog from Canvas
Steps here [Roxi to check with Greg and team and will add images on response]
Lineage tab in jobs
The Lineage tab in dbt jobs displays the lineage associated with the job run. Access Catalog directly from this tab, allowing you understand dependencies/relationships of resources in your project.
Access Catalog from the lineage tab
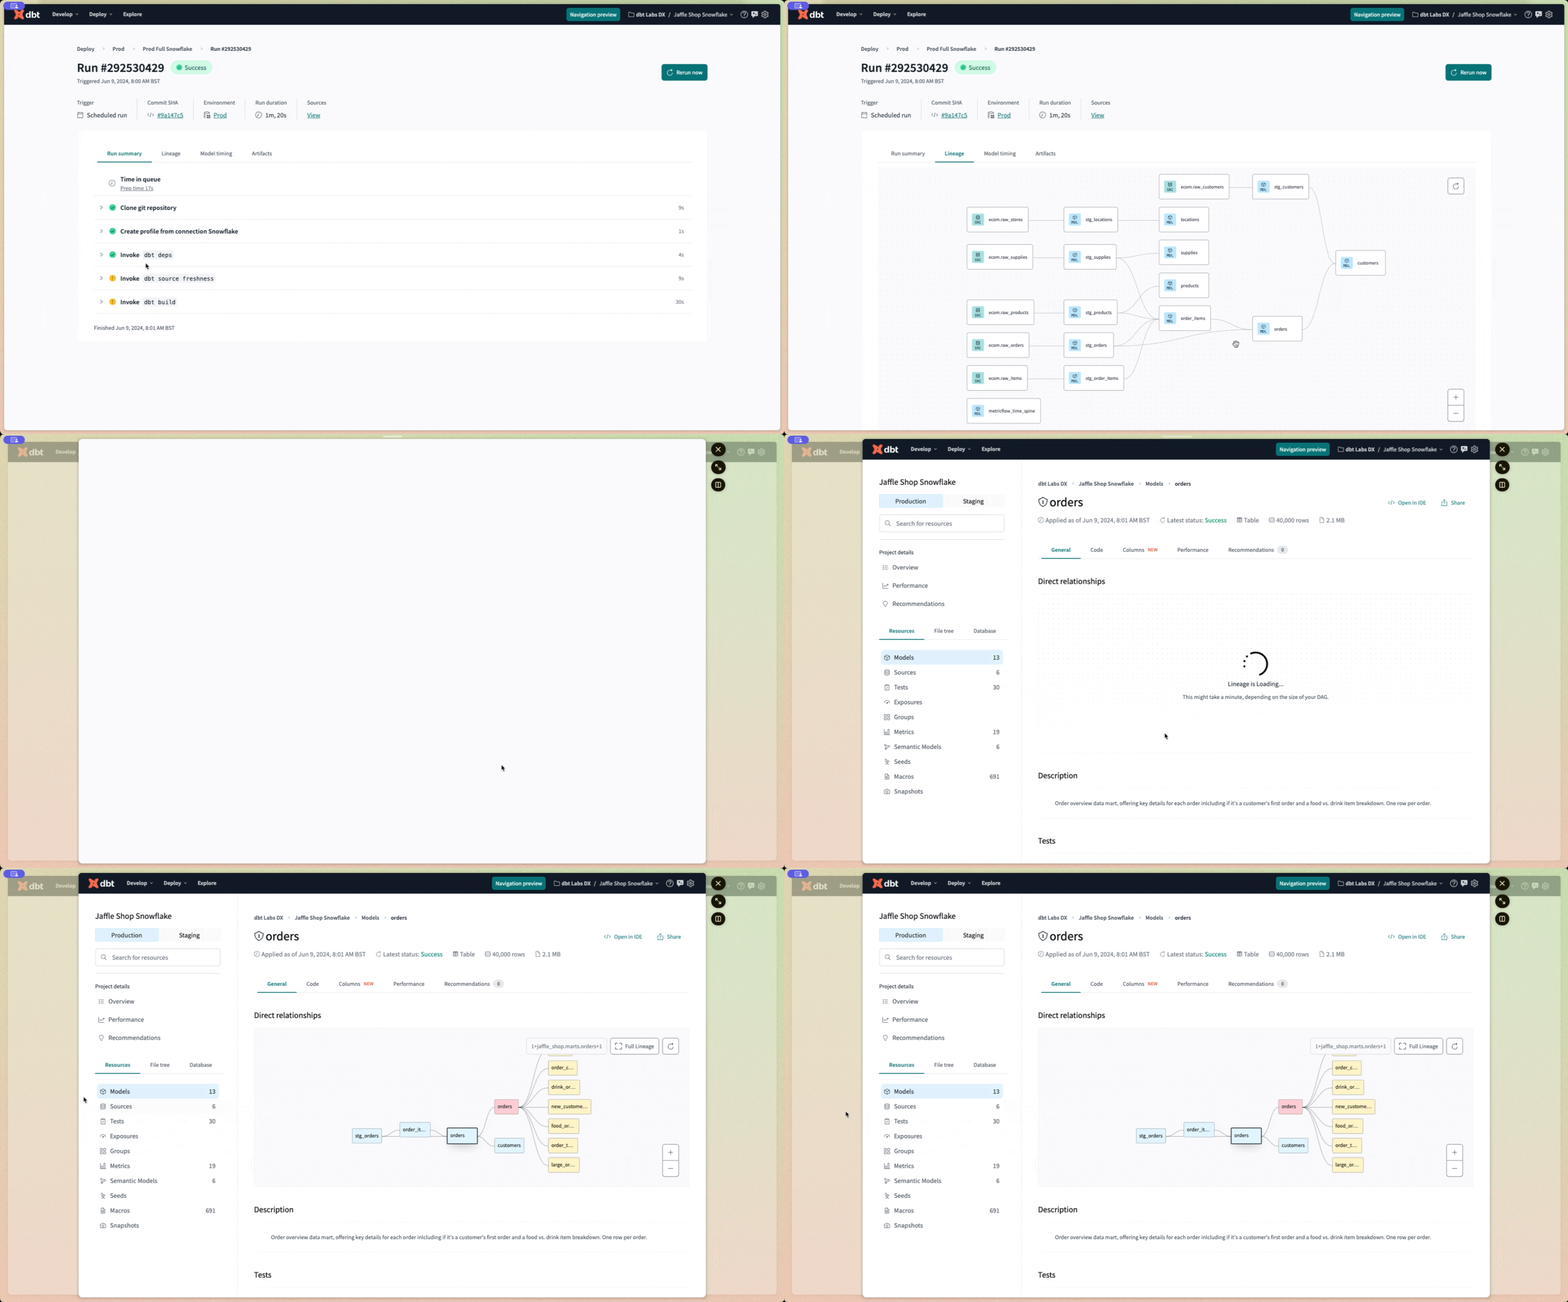
- From a job, select the Lineage tab.
- Double-click the node in the lineage to open a new tab and view its metadata directly in Catalog.
Model timing tab in jobs StarterEnterpriseEnterprise +
The model timing tab in dbt jobs displays the composition, order, and time taken by each model in a job run.
Access Catalog directly from the modeling timing tab, which helps you investigate resources, diagnose performance bottlenecks, understand dependencies/relationships of slow-running models, and potentially make changes to improve their performance.
Access Catalog from the model timing tab
- From a job, select the model timing tab.
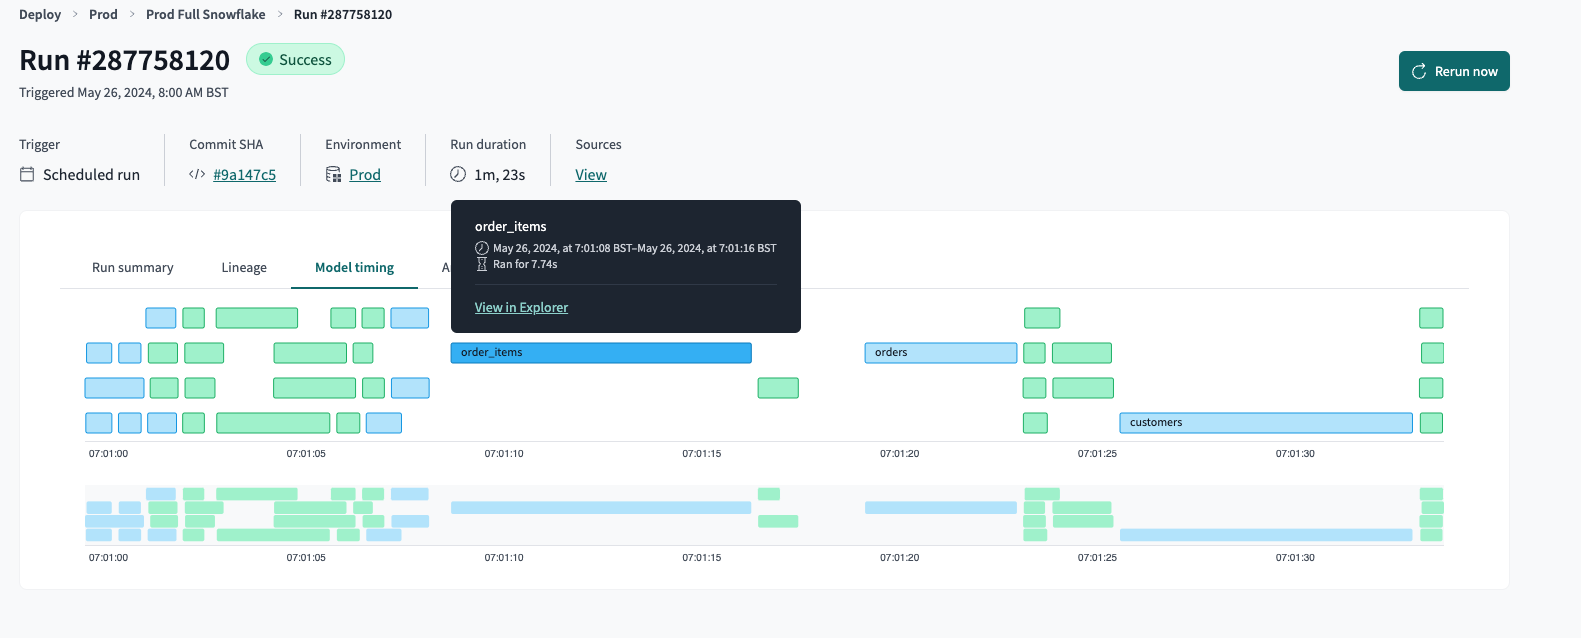
- Hover over a resource and click on View on Catalog to view the resource metadata directly in Catalog.
 Access dbt Catalog from the model timing tab by hovering over the resource and clicking 'View in Explorer'.
dbt Insights EnterpriseEnterprise +
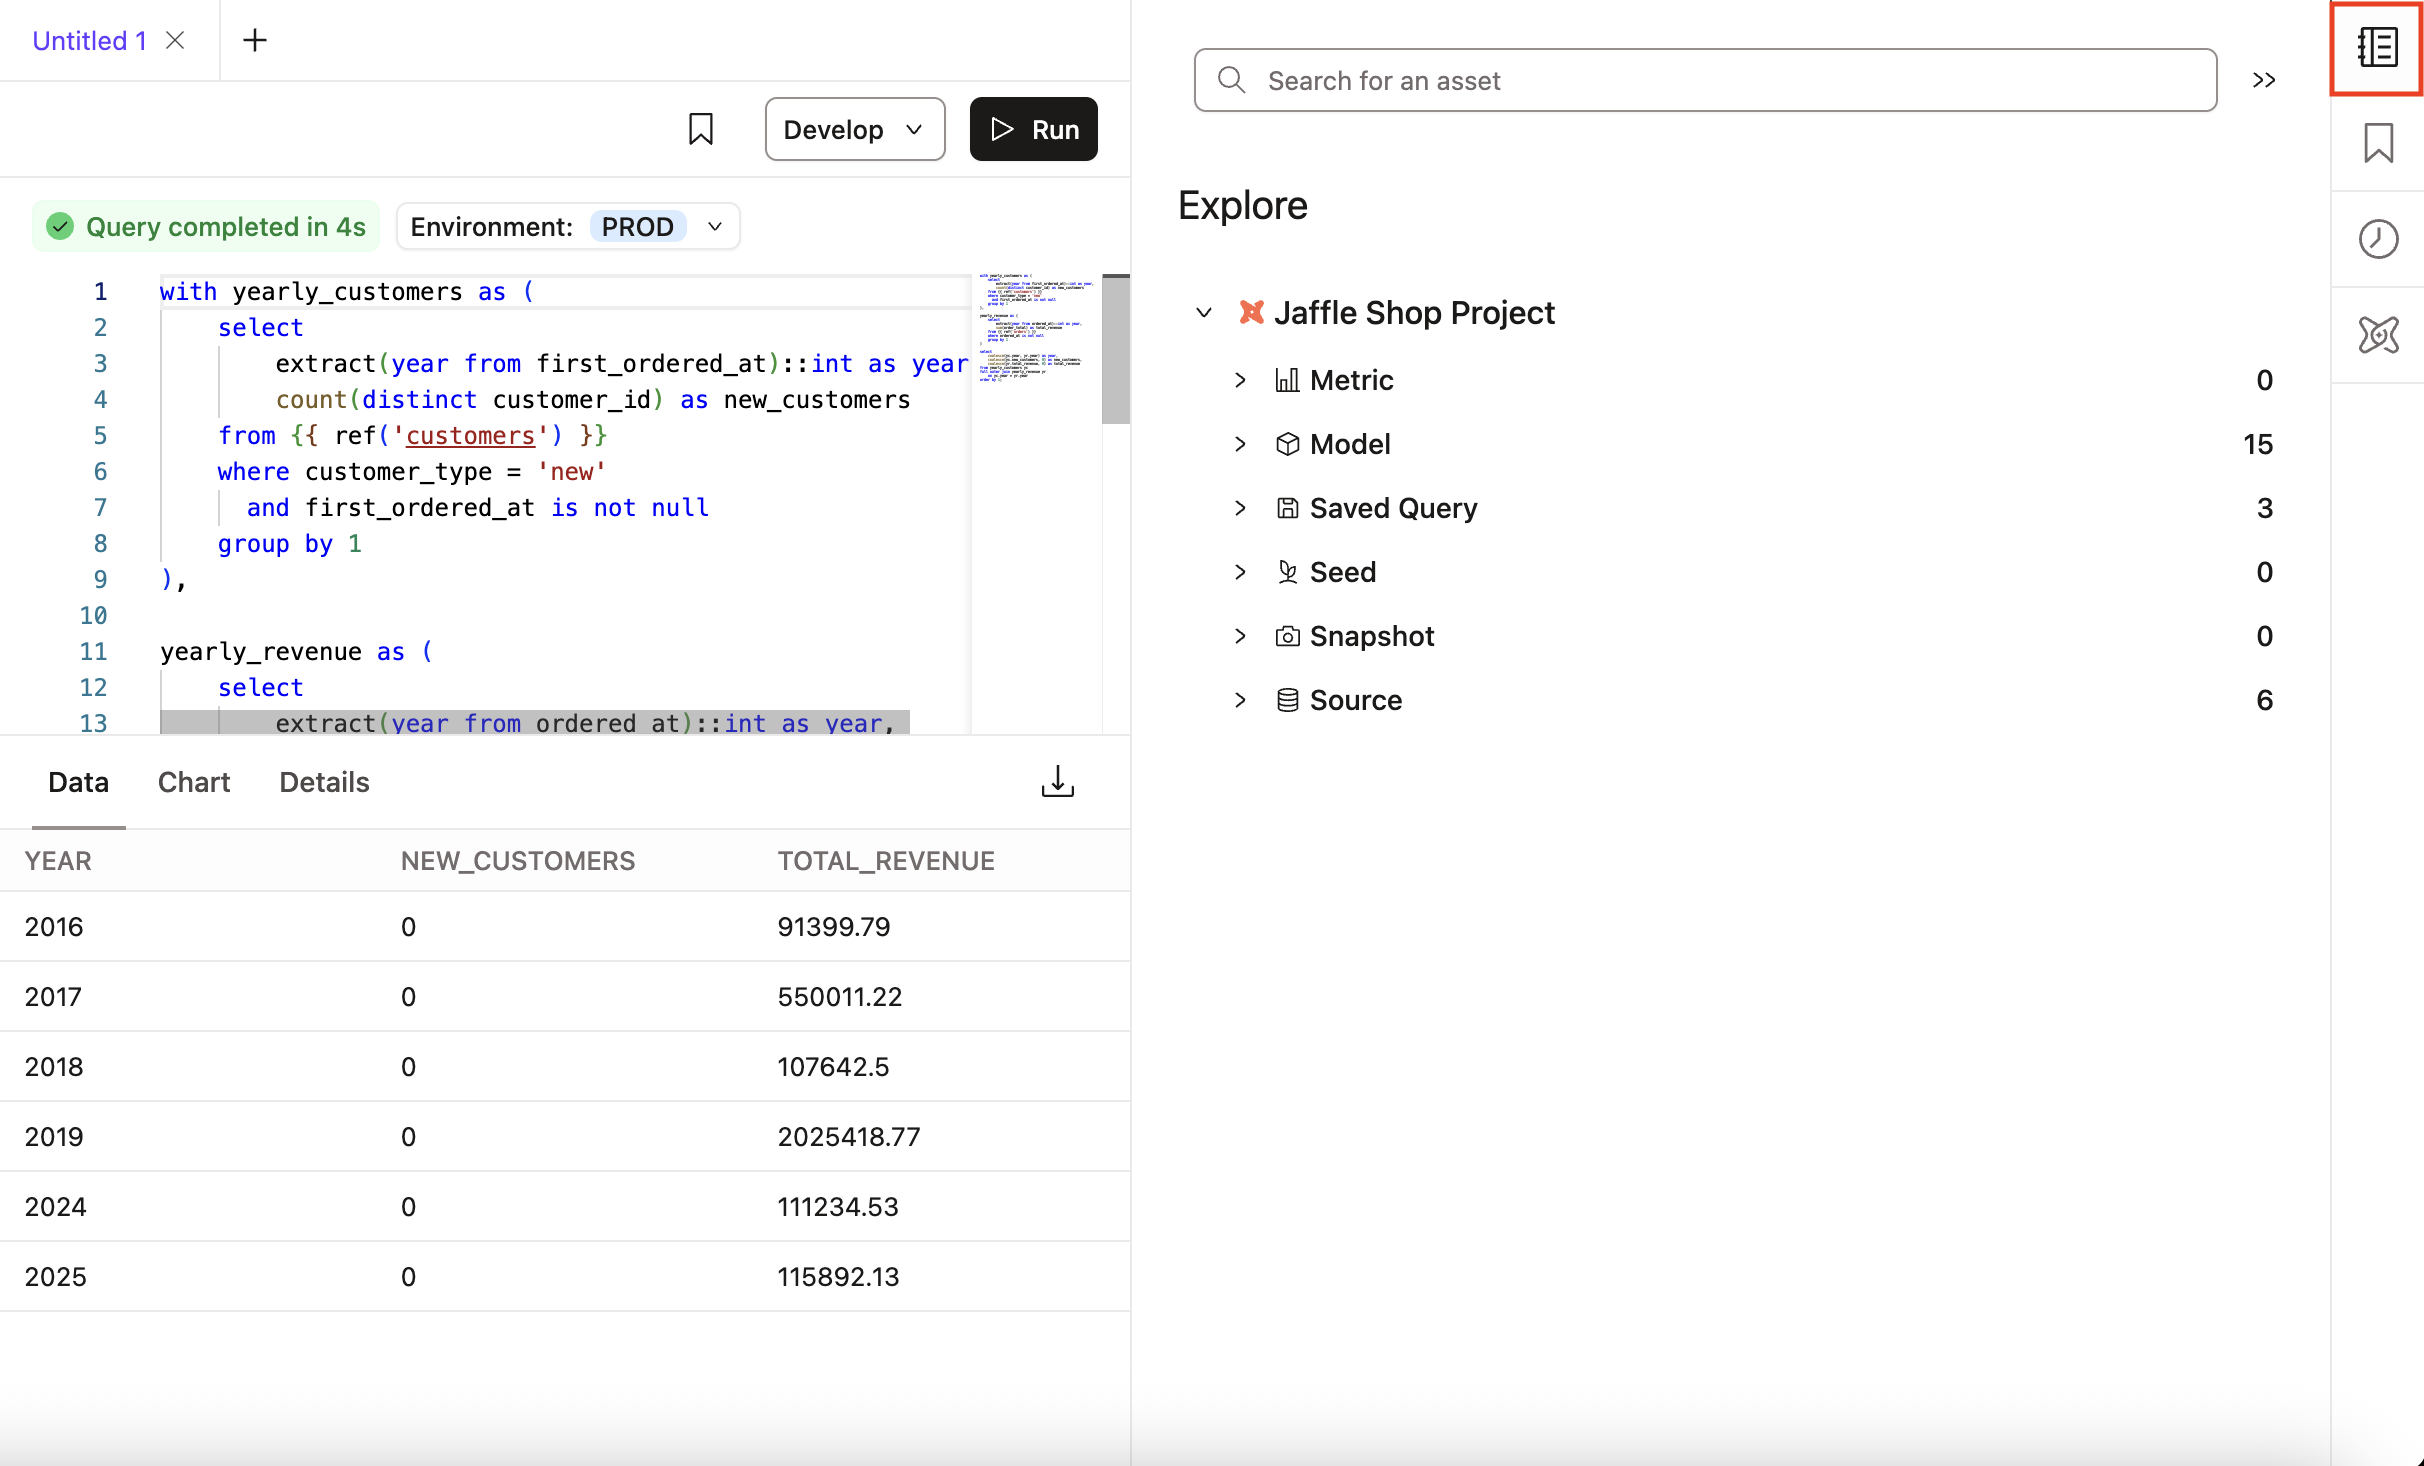
Access Catalog directly from Insights to view the project lineage and project resources with access to tables, columns, metrics, dimensions, and more.
To access Catalog from Insights, click the Catalog icon in the Query console sidebar menu and search for the resource you're interested in.
Was this page helpful?
This site is protected by reCAPTCHA and the Google Privacy Policy and Terms of Service apply.

