Founding an Analytics Engineering Team

Executive Summary:
If your company is struggling to leverage analytics, dealing with an overgrown ecosystem of dashboards/databases or simply want to avoid the mistakes of others, this story is for you. In this article, I will walk through forming the first analytics engineering team at Smartsheet including how momentum built around forming the team, the challenges we faced, and the solutions we developed within the first year.
Introduction
Most writing about analytics engineering, or AE for short, assumes a team already exists. It’s about operating as an AE team or managing stakeholders or leveraging tools more effectively. But what about the prologue? What initial problems do AEs solve? How does an AE team even start? What do the early days look like?
Enter this story. I’m Nate and I manage the Analytics Engineering team at Smartsheet, a software platform that helps you manage your work. We’re not a large team, just me and two others. A lot went into the formation of our team and this is that story. I’ll tell it in three parts:
- State of Analytics Before AE
- Selling & Starting the AE team
- Technology & Database Design
State of Analytics Before Analytics Engineering
Smartsheet, in general, has a great analytics setup. Strong data engineering and data analytics teams. A cloud data warehouse and an on-prem BI tool for front-end data visibility. However, even with that foundation, there were some limitations under the hood requiring action:
(1) Multiple undocumented transformation databases
Organic growth of a company usually translates to organic growth of the database. One table became two, became fifteen, became too many to count. Analysts who built key tables left, new analysts joined and re-made or duplicated key tables. Suddenly, “the truth” was hard to find as data sprawl increased.
Expanding data meant increasing difficulty finding The Truth within the database. Analysts gained knowledge inefficiently and over a long period of time of discussions and trial and error. With limited documentation and a growing database, this challenge continued to expand as more and more analysts came on board.
(2) Analysts could only ship code once every 1-2 weeks
Analysts need a process to “productionalize” tables where their code is version controlled and is run on a schedule. Such a process existed at Smartsheet for analysts, but the issue was that deployments only happened once per week. The existing data engineering workflow understandably emphasized stability and reliability, with analysts simply hitching a ride. This meant a tradeoff on speed and agility as it was a one to two week process for any analyst to get new or updated code into the repository, no matter how simple.
For example, this meant if an analyst noticed some incorrect data on a dashboard, it was a long process to get that fixed. The business moved too fast to wait a week or two for data to update.
(3) Data & business logic siloed in visualization layer
Analysts found the pressure release valve around problem two in the visualization tool. It turns out that visualization tools can:
(a) Hold a custom SQL script
and
(b) Run that script on a schedule.
Voila, new analytics code now deployed more often than once per week. But it came with a downside as data and business logic became even more siloed than before.
With undocumented and undiscoverable logic embedded in custom code buried deep within a dashboard workbook instead of in database tables, the data ecosystem became brittle and unmaintainable. Whenever raw data or business logic changed, no one had any idea which dashboards went sour (hint: usually it was the business users seeing “something off”). Discovering data became even more difficult. Data silos deepened between team members. Thousands of dashboards appeared.
The above problems are not uncommon for most companies and you can get by like this for a while. But as the scale of these challenges compounded, laying the foundation for the formation of an analytics engineering team.
Justifying & Starting the Analytics Engineering Team
Making our case
We just didn’t realize it yet, but momentum for an AE team was building. Several internal analysts, including myself, knew things could be better and discussed a new schema holding core transformed tables. One analyst in particular (who later became the core engineer of the AE team) created crucial tables which everyone needed. I joined the effort. We gained traction rapidly as we sold its value to other analysts and it immediately saved everyone time and effort.
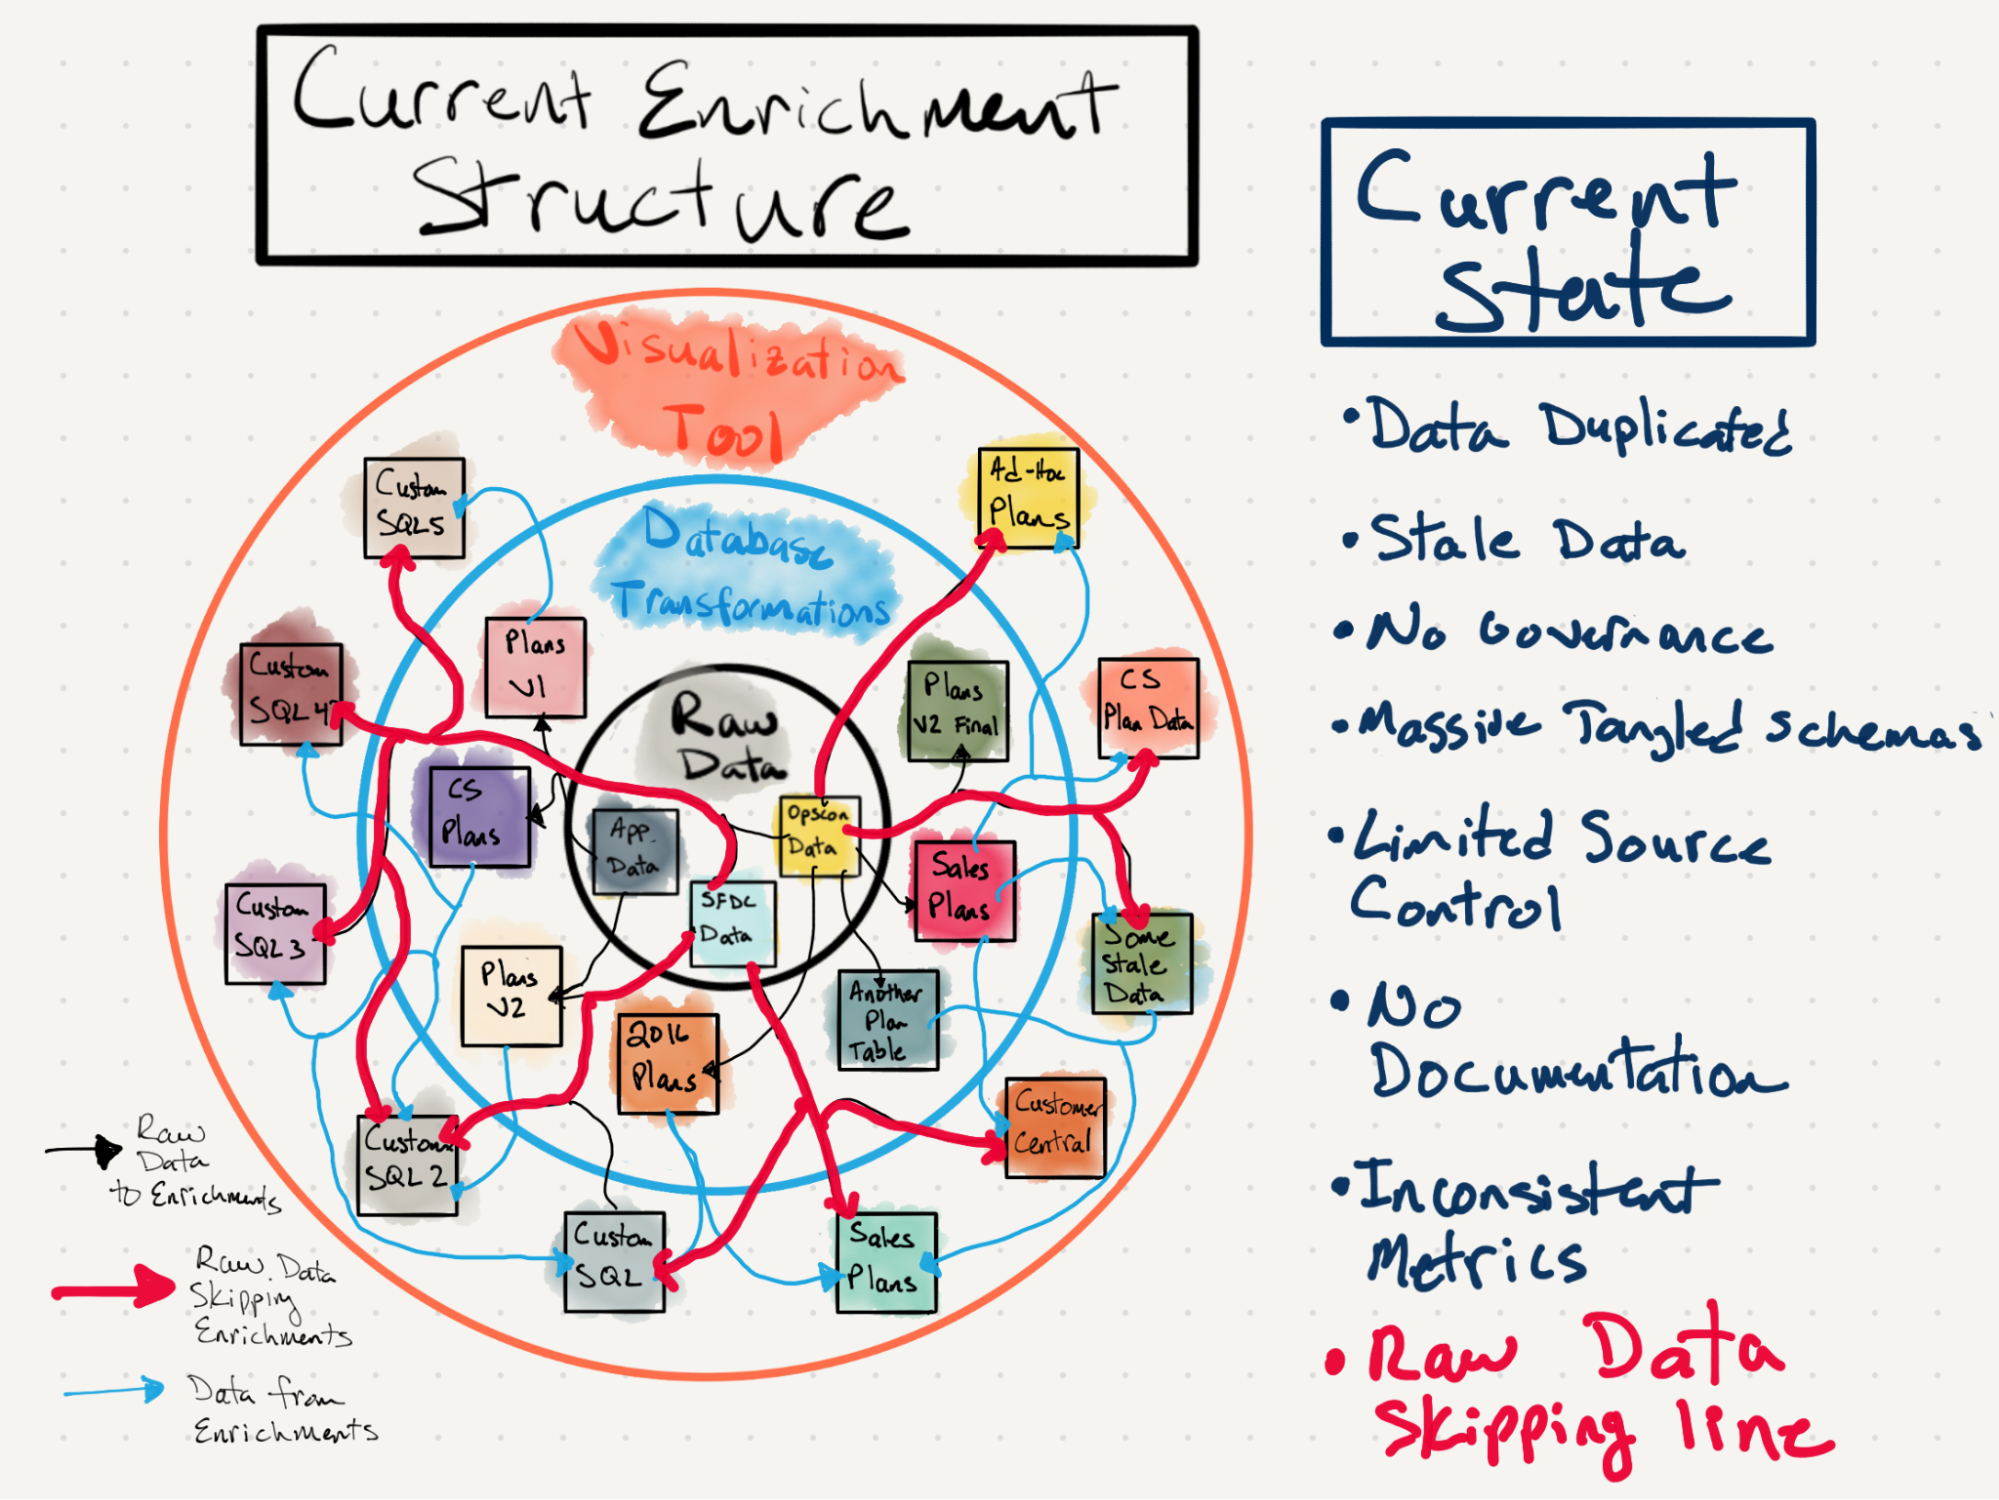
Around this same time, I discovered the Locally Optimistic data community and learned the name of our efforts: Analytics Engineering. Given our clear need for this internally and the early traction of our initial schema, my job became clear: Smartsheet needed Analytics Engineering. I put together a couple slide decks going over our analytics issues and why an AE practice would help. For example, I drew a chart showing our existing messy data ecosystem:
I also presented slides going over solutions to these issues. After all, outlining problems is easy; bringing solutions is difficult.
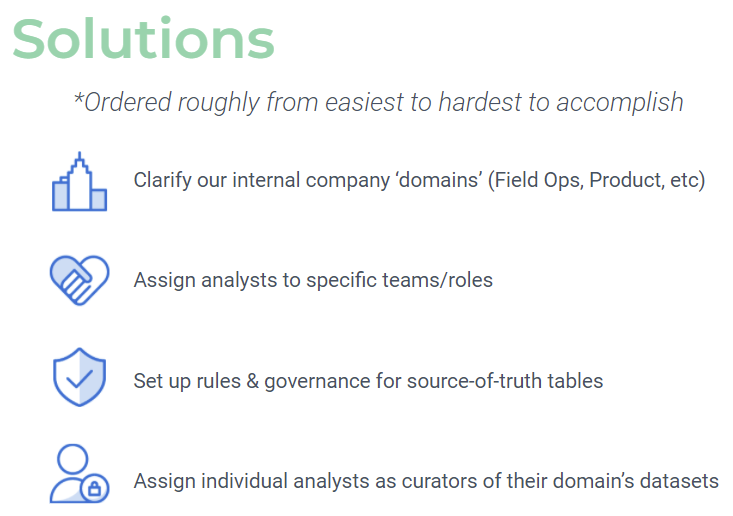
The core of the solutions at the time seemed simple. It boiled down to:
Let’s just make some more tables in that source of truth schema, with some additional governance and clarity of ownership.
More on this in a bit - turns out this was only part of the solution.
After a few meetings, additional discussions and a couple months, the opportunity crystallized: I and the analyst creating most source-of-truth tables would form the team. We would have one more headcount to hire. We officially became a team on Valentines Day, a true Data Love Story.
The early days and re-scoping our mission
As mentioned earlier, we set off thinking “let’s just make some more tables in that trusted schema, except make them more organized.” So we compiled a list of tables asking questions like, what do we need to make? And more importantly, how do we make it scalable?
The list of tables grew and grew. Enough that we started to realize a single schema wouldn’t pass muster. If we just made a ‘faster horse’ we would repeat the existing problem: too many tables in one place, all tangled up. After a couple months of planning and strategizing (delayed in part due to my parental leave, which I’m very thankful Smartsheet provides!), we thought to ourselves: what if we start fresh with our own database?
Something magical happened over the period of a couple weeks. We started asking even more “What if?” questions. They included:
What if we chose our own set of tools?
What if we overhauled the analytics code production process?
What if analysts could ship early and often instead of every few weeks?
What if we cleaned up the old reporting ecosystem at the same time?
A dozen light bulbs went off at once. We could change everything. We could make everyone’s time more effective and efficient.
I remember going into a meeting with our team SVP after realizing we should do more than just make some clean tables. I told him “this project is a lot bigger than we signed on for, there’s so much to do to get it right.” He was gracious to give us some more time, with the expectation that we’d deliver something within the year. It was time to get to work. We not only needed to make some clean data, choose our tools, overhaul the analytics code production process and significantly clean the old reporting ecosystem. It would take a marathon sprint to get there. The question of “What if” became “When?” We ambitiously chose by the end of the calendar year and off to the races we went.
Technology & Database Design
While this expansive project required numerous decisions, I want to highlight three primary and important decision points early on in our development.
Technology Stack
As mentioned earlier, the Smartsheet data stack was already pretty modern—including our cloud data warehouse. We also used some other modern on-prem or in-house tools in the existing analytics stack. However, we had a rare chance to take a step back and choose anew.
In the interest of getting a proof of concept out the door (I highly favor focus on delivering value quickly and then iterating improvements), we settled on a small and compact tech stack:
- Our own Dev, Prod & Publish databases
- Our own code repository which we managed independently
- dbt Core CLI
- Virtual Machine running dbt on a schedule
None of us had used dbt before, but we’d heard amazing things about it. We hotly debated the choice between dbt and building our own lightweight stack, and looking back now, I couldn’t be happier with choosing dbt. While there was a learning curve that slowed us down initially, we’re now seeing the benefit of that decision. Onboarding new analysts is a breeze and much of the functionality we need is pre-built. The more we use the tool, the faster we are at using it and the more value we’re gaining from the product.
For example, we previously used a separate tool to schedule DAGs. There was quite the spaghetti graph to keep straight and the tool became a headache for analysts. With dbt setting our DAGs automatically during the run, we could (and can) focus on more important tasks.
I’m certain that if we’d chosen to roll our own homemade transformation pipeline, we’d be operating at a much slower pace today.
Our own take on Data Mesh
In the midst of the Great Data Mesh Debate, we were silently applying pieces of Data Mesh into our database design. Specifically, we truly believed that separating out ownership and/or structure of data by domain within the company was a valuable step. Certain departments know certain pieces of information, and it is normal in transformations to join those things together to solve common use cases.
We believed this because our goal was to have wide, denormalized tables covering specific concepts like “Accounts”, “Users” or “Contracts”. The issue with wide tables is that a lot of columns from a lot of different ‘owners’ are needed. That sounded like a nightmare. If everyone owns a table, no one owns the table.
Then, the lightbulb came suddenly one day. We realized that the ownership of data could be at the column level, not just at the table level. That piece of the puzzle unlocked our design.
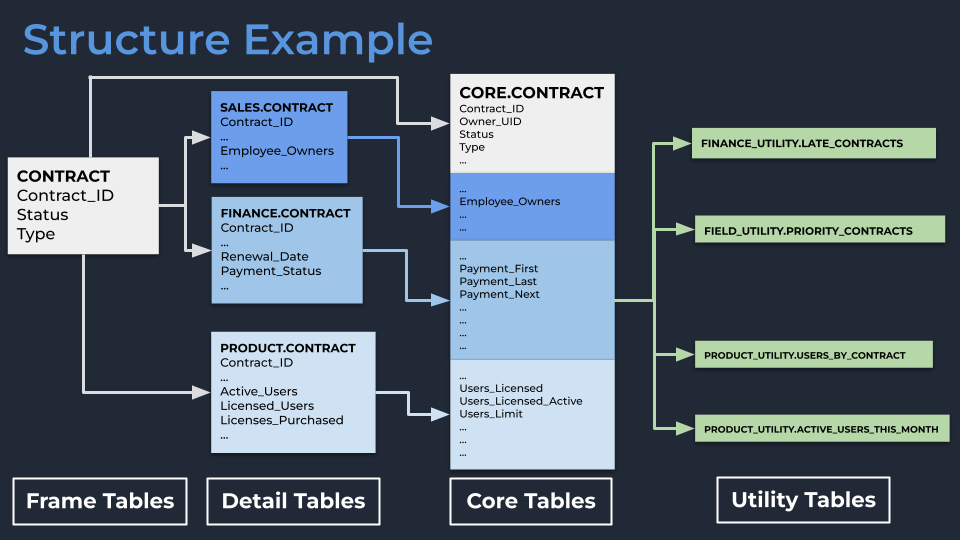
- Each core ‘object’ in our database (e.g., a customer Contract) would start with a Frame table, which was just a simple table holding one row for each record to serve as the backbone of downstream transformations (e.g., a list of all unique Contract IDs).
- Each department would then take that Frame into their own schema and own their Detail version of the table. Finance would have the Finance.Contract table, Product would have Product.Contract table, etc. These were simply left joins of the Frame table with the columns about which each domain could supply trustworthy information. For example: Finance knows the value and when that contract is up for renewal, Product knows how many active users there are for that contract, and Sales knows the value of open opportunities for that contract’s renewal.
- We would then take those disparate Contract tables and join them together into our Core schema. Since all of these tables share the same root Frame table, the join is simple and there are no duplication issues or confusion about what counts as a contract.
- We left room for a Utility set of schemas for teams to take Core tables and build their own tables for specific use cases, knowing that not every use case ended in a wide table.
This twist on Data Mesh gave us a strong foundation to build around. Enforcing ownership of columns at the domain level is important since data experts should contribute their knowledge into tables others can leverage. Previously, those experts contributed knowledge when someone asked around. Now that knowledge lives in intuitive locations of the database, discoverable by anyone.
Data flow from Raw to Prod
With the structure figured out, we turned our attention to the nitty gritty details and, wow, this was overwhelming. None of us came from a data engineering background. We had never created databases or maintained them, or thought about permissions, run schedules or disaster recovery. But there were decisions to make and we ran headlong into tackling them one at a time.
For example, we originally assumed the data flow from Raw into its Prod state would be relatively simple: Raw → dbt magic → Prod. But that ‘dbt magic’ part had many layers to it. Where will dbt run? How do we schedule it? How do we make sure data is in sync? What does being in sync even mean? How often do we update the database? What happens if one model is queried in the middle of an update? How do we make sure the right people see the right objects?
To get through the fog of questions, we chose one principle on which to plant our flag: Data must be in sync and always accessible across the database. In our existing database, if you queried a table mid-update: too bad. You got weird data and might not even know it, or your query would fail. We wanted to do better and our cloud data warehouse provided the platform we needed to make it happen.
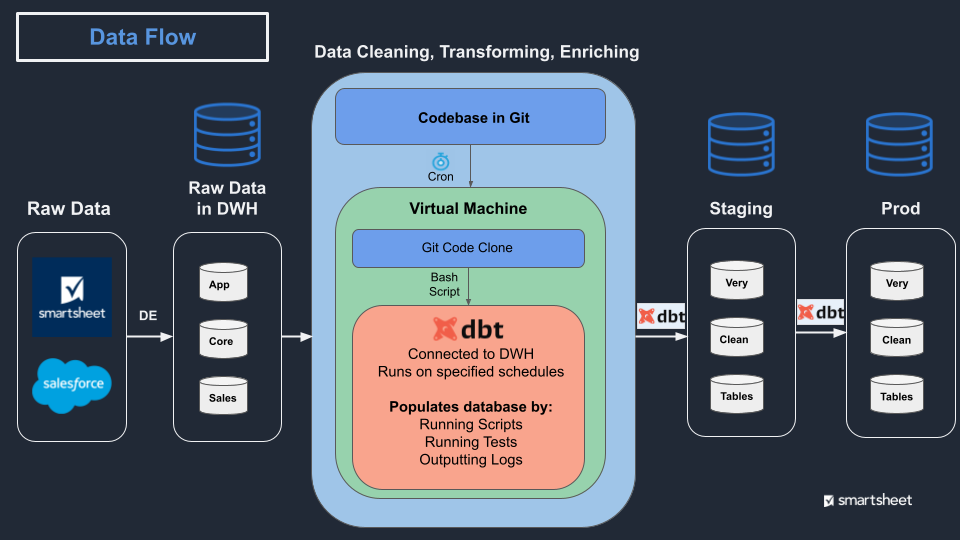
We settled on the following data transformation flow. Our transformation code is pulled every 8 hours onto a virtual machine (VM). A script on that VM triggers dbt to run that code, populating a staging database which is visible only to my team. Staging continues to update table by table until the run is successful. When successful, Staging immediately clones over to Prod, with no downtime for users even if they are mid-query. Everyone is happy.
This is scratching the surface of the decisions we made, but I hope it’s helpful in illuminating some of the hidden decisions one makes when designing a reliable analytics database.
V1 Launch
Starting around August, not only was the vision clear, we also had a plan of attack of what to make for V1. Planning and strategy time was largely over; it was time to execute and deliver value.
I could write much more about each of these and the entire story of how we went from August to December but we’ll have to save that for another day. By December 20, 2021, we completed three key deliverables which will become the foundation for an internal analytics renaissance.
70+ enriched tables in dbt refreshing every eight hours
We identified the core tables which covered the broadest swaths of use cases and laser focused on those. We delivered 70 tables in total, with highlights of:
- 17 Core tables joined from the building blocks discussed in the prior section,
- Multiple Journal tables (i.e., one row per change to a record) that had been on the “we want these” list for analysts for years, such as Account history and User history. These existed prior in a very raw format; good luck avoiding landmines and/or writing efficient queries on raw data, and
- Meta tables giving up to date statistics on each model such as their data freshness.Up to this point, analysts had no idea how fresh the data was in a table and you couldn’t confidently tell a stakeholder through when the data on a dashboard was accurate.
Plenty more to make but the foundation was there, and now it was time to enroll other analysts in this process. This is a significant step toward unwinding the tangled data ecosystem described in problem one at the beginning of this article.
Brand new code production process
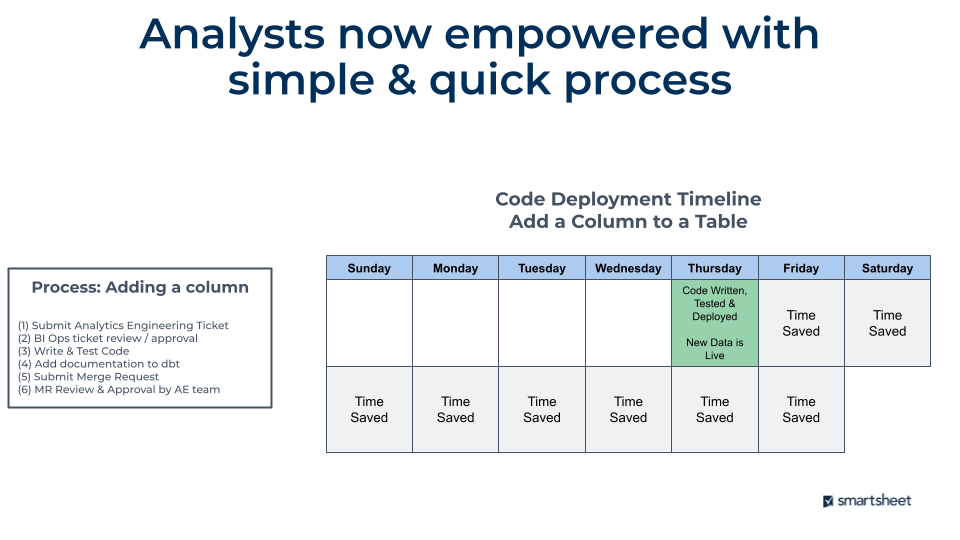
This topic also deserves its own blog post, but I’ll attempt to quickly describe what we changed. As described in the problem statement, analysts could only ship code every 1-2 weeks and the process was incredibly painful. It was more than 16 steps with multiple ‘gotchas’ where analysts would get stuck and waste time.
The process is now six steps, with massive time savings for the analytics team both in the creation and testing of their script along with how long it takes for new data to get into the data warehouse.This is on top of all of dbt’s benefits such as data definitions, lineage, automatic testing, macros…the list goes on.
Cleaned up dashboard/reporting ecosystem
With clean tables in place and a strong process to create even more, it was time to tackle dashboarding/reporting. Over 1,000 workbooks contained over 5,000 dashboards, built up over years of analysts adding in ad-hoc queries and letting them run.
I started by setting up a process with criteria determining which dashboards to delete: if your dashboard isn’t used, it’s getting deleted. At first, the rule was “no views within six months” but then it tightened to “less than five views within six months”. Soon, it will move to “less than five views within three months” and we’ll tweak from there.
Next, I send out a monthly Smartsheet which lists all dashboards set for deprecation, notify everyone who owns at least one workbook, and give them the requirement of explaining why their workbook should remain. So far, very few dashboards receive a request to remain and most are allowed to expire by the owners.
As of now, we’ve retired 50% of all workbooks (roughly 500) which contained 42% of all dashboards (roughly 2,100). We’re confident that this cleanup will pair with less and less demand to make workbooks. The code automation process with dbt will also significantly relieve the pressure that drove analysts to over-rely on our visualization tool for data refreshing.
All of this cascades into many benefits that Smartsheet will benefit from going forward:
- Less business logic living in disparate systems (it shouldn’t be in there in the first place!)
- Fewer reports breaking when business logic does change
- Discoverability of the important reports greatly improved for business users
The Road Ahead
All the above brings us to today. It’s been an amazing, stressful, ridiculous journey over the last year. Lots of learning and mistakes and triumphs and failures and everything in between. I’m in awe of the team as they took on this incredible task with gusto and grit. I’m proud to work alongside them each day.
It’s difficult to remember to pause and look back and see where you came from, especially when the mountain in front of you still feels larger than life. This blog is partially an attempt to do just that. We’ve come far, and we have momentum going forward.
My hope is this story is helpful for you, wherever you are on your analytics journey. I’m certain the above isn’t unique to Smartsheet and is common. We’re all in good company.
The road ahead is both clear and unclear. But there is one primary focus we have for the upcoming year: Adoption, Adoption, Adoption
Even if we build the most amazing process on top of the most amazing tools available, it’s irrelevant if internal adoption lags. Our team of three is incapable of delivering everything Smartsheet needs, and our design intentionally avoids us becoming an internal bottleneck. Instead, we are enablers. We have to move away from our old enrichment databases and build anew in the new database. We have to onboard new analysts into our new process. We have to apply this new foundation to better serve our internal customers.
So the focus is now on adoption. What does this mean for analysts? What does this mean for internal stakeholders? How do we leverage all this newfound power into better self-serve tools and more agile data teams?
We have some ideas - but that’s for another blog post. What is certain is my job is turning into an internal sales and marketing position. Good thing I started out in Customer Success before going into analytics; it’s time to put that hat back on.