How does dbt pricing work?
As a customer, you pay for the number of seats you have and the amount of usage consumed each month. Seats are billed primarily on the amount of licenses purchased.
Usage is based on the number of Successful Models Built and, if purchased and used, Semantic Layer Queried Metrics subject to reasonable usage. All billing computations are conducted in Coordinated Universal Time (UTC).
What counts as a seat license?
You can learn more about allocating users to your account in Users and licenses. There are four types of possible seat licenses:
- Analyst* — for permission sets assigned and shared amongst those who don't need day-to-day access.
- Developer — for permission sets that require day-to-day interaction with the dbt platform.
- IT — for access to specific features related to account management (for example, configuring git integration).
- Read-Only — for access to view certain documents and reports.
* The Analyst license type is not available for new purchase.
What counts as a Successful Model Built?
A Successful Model Built is any model successfully built in a dbt deployment environment through dbt’s orchestration. This includes jobs run via the scheduler, CI builds (triggered by pull requests), and runs kicked off via the dbt API. Models that build successfully are counted even if the overall run later fails. For example, if a job containing 100 models fails after 51 are built, only those 51 are counted.
Any models built in a dbt development environment (for example, via the Studio IDE) do not count towards your usage. Tests, seeds, ephemeral models, and snapshots also do not count.
When a dynamic table is initially created, the model is counted (if the creation is successful). However, in subsequent runs, dbt skips these models unless the definition of the dynamic table has changed. This refers not to changes in the SQL logic but to changes in dbt's logic, specifically those governed by on_configuration_change config). The dynamic table continues to update on a cadence because the adapter is orchestrating that refresh rather than dbt.
| What counts towards Successful Models Built | |
|---|---|
| View | ✅ |
| Table | ✅ |
| Incremental | ✅ |
| Ephemeral Models | ❌ |
| Tests | ❌ |
| Seeds | ❌ |
| Snapshots | ❌ |
When dbt State is enabled, a reused model (skipped or cloned) doesn't count as a Successful Model Built. They're billed separately as daily active target tables (DATTs). For more information, refer to dbt State usage.
What counts as a Queried Metric?
The Semantic Layer, powered by MetricFlow, measures usage in distinct Queried Metrics.
- Every successful request you make to render or run SQL to the Semantic Layer API counts as at least one queried metric, even if no data is returned.
- If the query calculates or renders SQL for multiple metrics, each calculated metric will be counted as a queried metric.
- If a request to run a query is not executed successfully in the data platform or if a query results in an error without completion, it is not counted as a queried metric.
- Requests for metadata from the Semantic Layer are also not counted as queried metrics.
Examples of queried metrics include:
-
Querying one metric, grouping by one or more dimensions → 1 queried metric
dbt sl query --metrics revenue --group-by metric_time -
Querying two metrics, grouping by two dimensions → 2 queried metrics
dbt sl query --metrics revenue,gross_sales --group-by metric_time,user__country
Compiling metrics counts the same way — one queried metric per metric compiled (for example, dbt sl query --metrics revenue --compile → 1 queried metric).
Viewing usage in the product
Viewing usage in the product is restricted to specific roles:
- Starter plan — Owner group
- Enterprise and Enterprise+ plans — Account and billing admin roles
If you have access to the Billing and Usage pages in Account settings, you can see an estimate of the month's usage, how your account tracks against it, and which projects are building the most models.
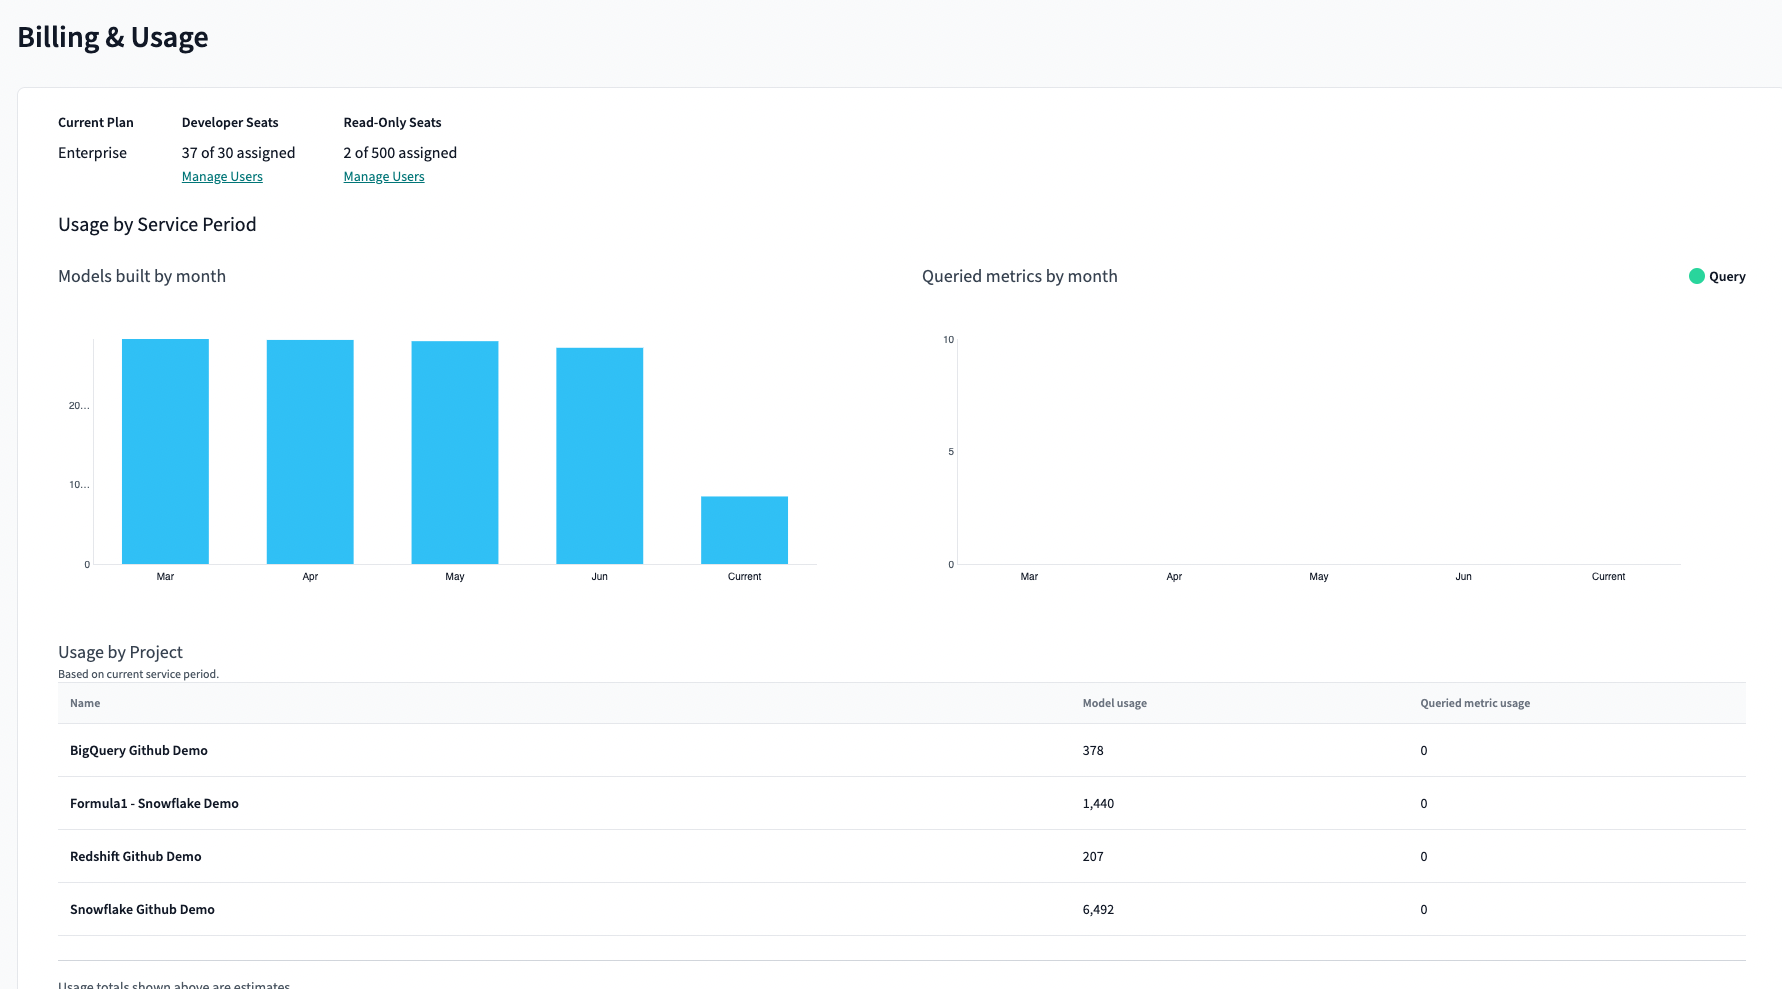 To view account-level estimated usage, go to 'Account settings' and then select 'Billing'.
As a Starter and Developer plan user, you can see how the account is tracking against the included models built. As an Enterprise plan user, you can see how much you have drawn down from your annual commit and how much remains.
On each Project home page, any user with project access can see how many models are built each month, with top jobs by models built available on each Environment page.
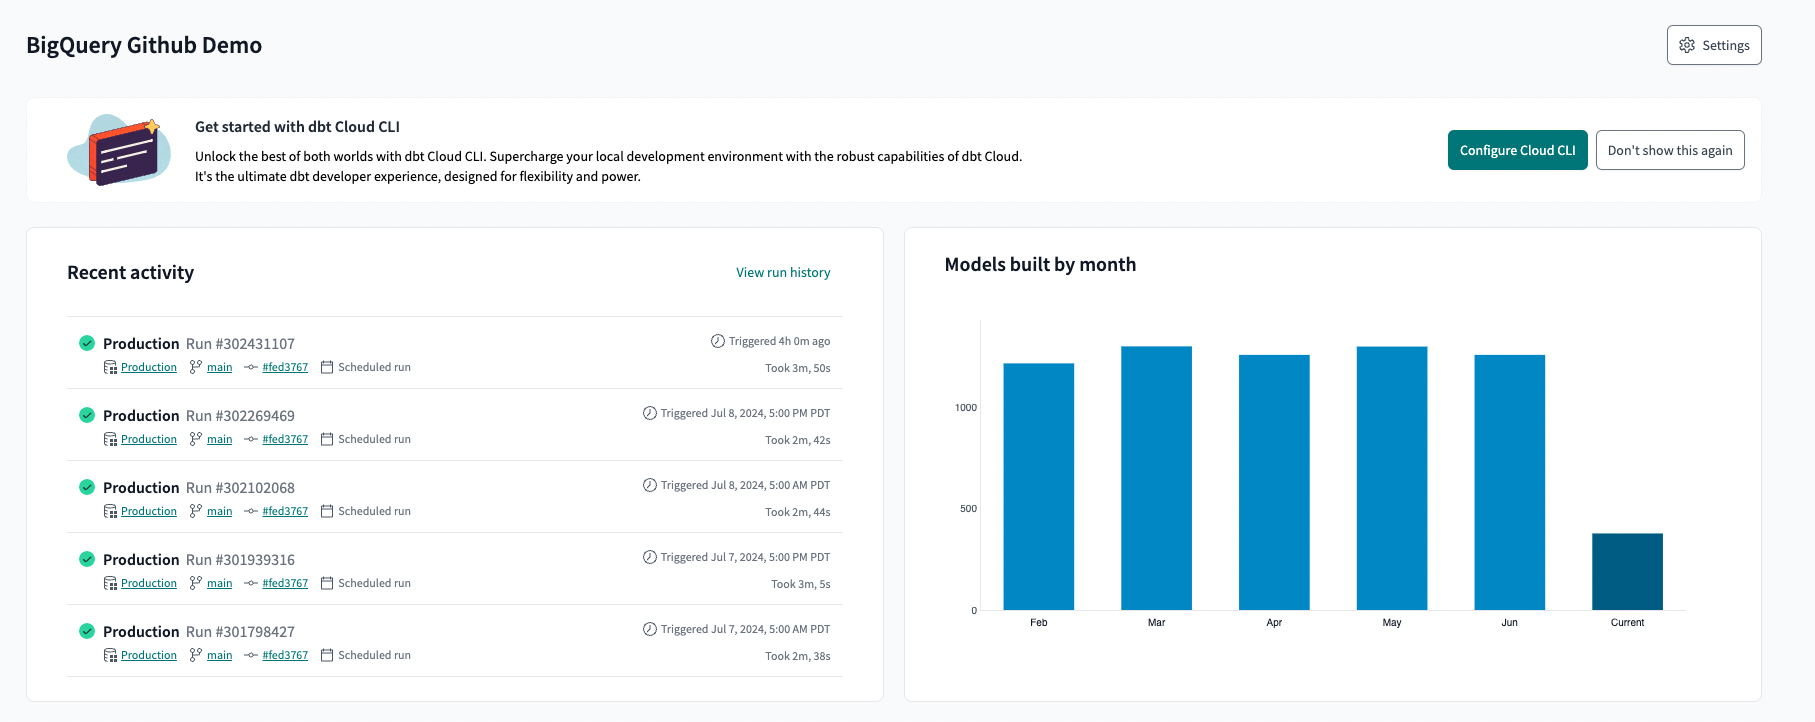 Your Project home page displays how many models are built each month.
The Job details page's Insights tab shows models built per month for that job and which take longest to build.
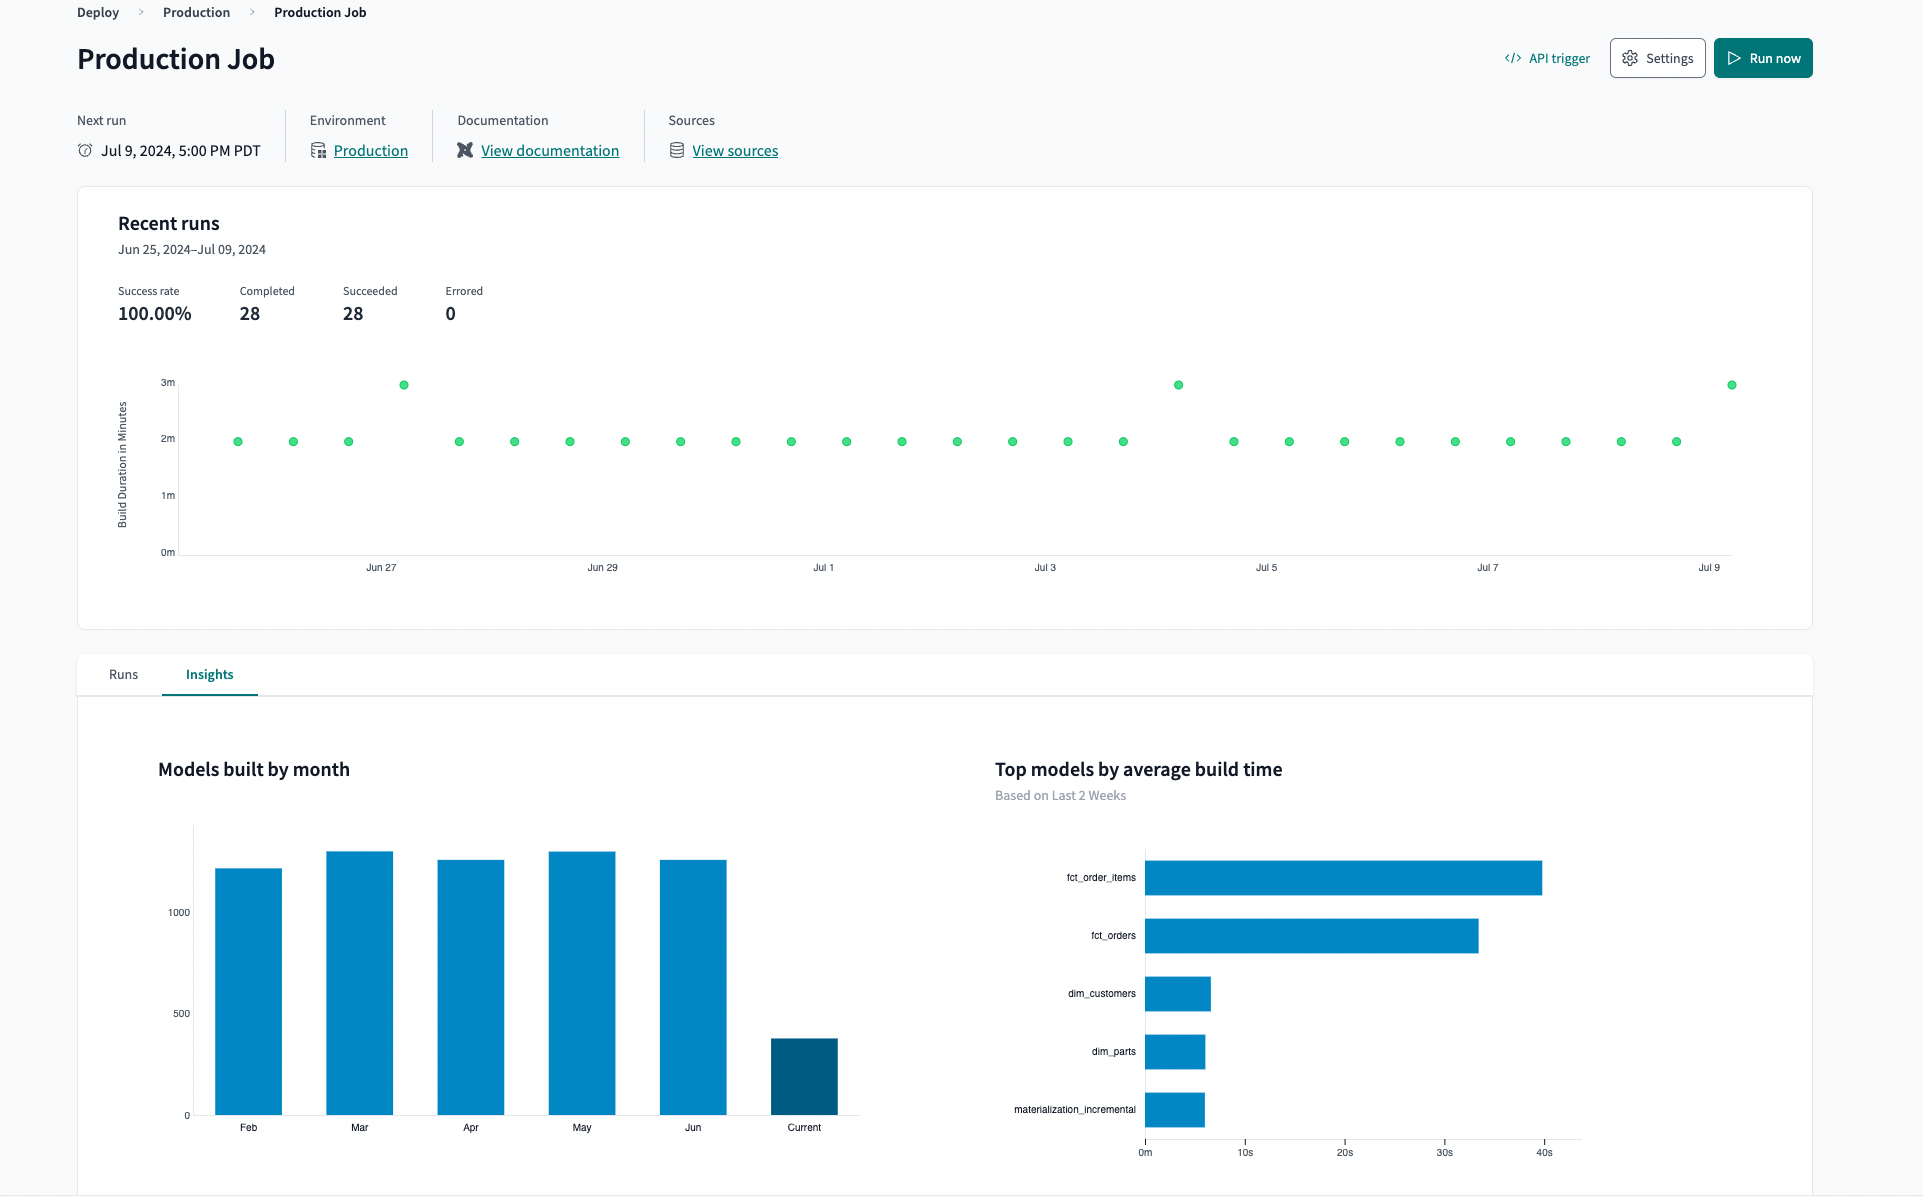 View how many models are being built per month for a particular job by going to the 'Insights' tab in the 'Job details' page.
Usage data shown in dbt is only an estimate and may be delayed, and some visualizations aren't available on legacy plans. Your final monthly usage appears on your monthly statements (Starter and Enterprise-tier plans).
Was this page helpful?
This site is protected by reCAPTCHA and the Google Privacy Policy and Terms of Service apply.