Explore cost data Private betaEnterpriseEnterprise +
You can access Cost Insights in these different dbt platform areas:
Each view provides different levels of detail to help you understand your warehouse spending and optimization impact. Cost and cost reduction estimates are based on historical runs and reflect actual usage, not forecasts of future costs.
Prerequisites
To view cost data, ensure you have:
- A dbt account with dbt Fusion engine enabled. Contact your account manager to enable Fusion for your account.
- One of the roles listed in Assign required permissions.
- A supported data warehouse: Snowflake, BigQuery, or Databricks.
For more information, see Set up Cost Insights.
For accounts already using state-aware orchestration before Cost Insights is enabled, at least one full model build must occur within the last 10 days to establish a baseline for cost reduction calculations. If you don't see cost reduction data, try running a full build to establish the baseline.
Project dashboard
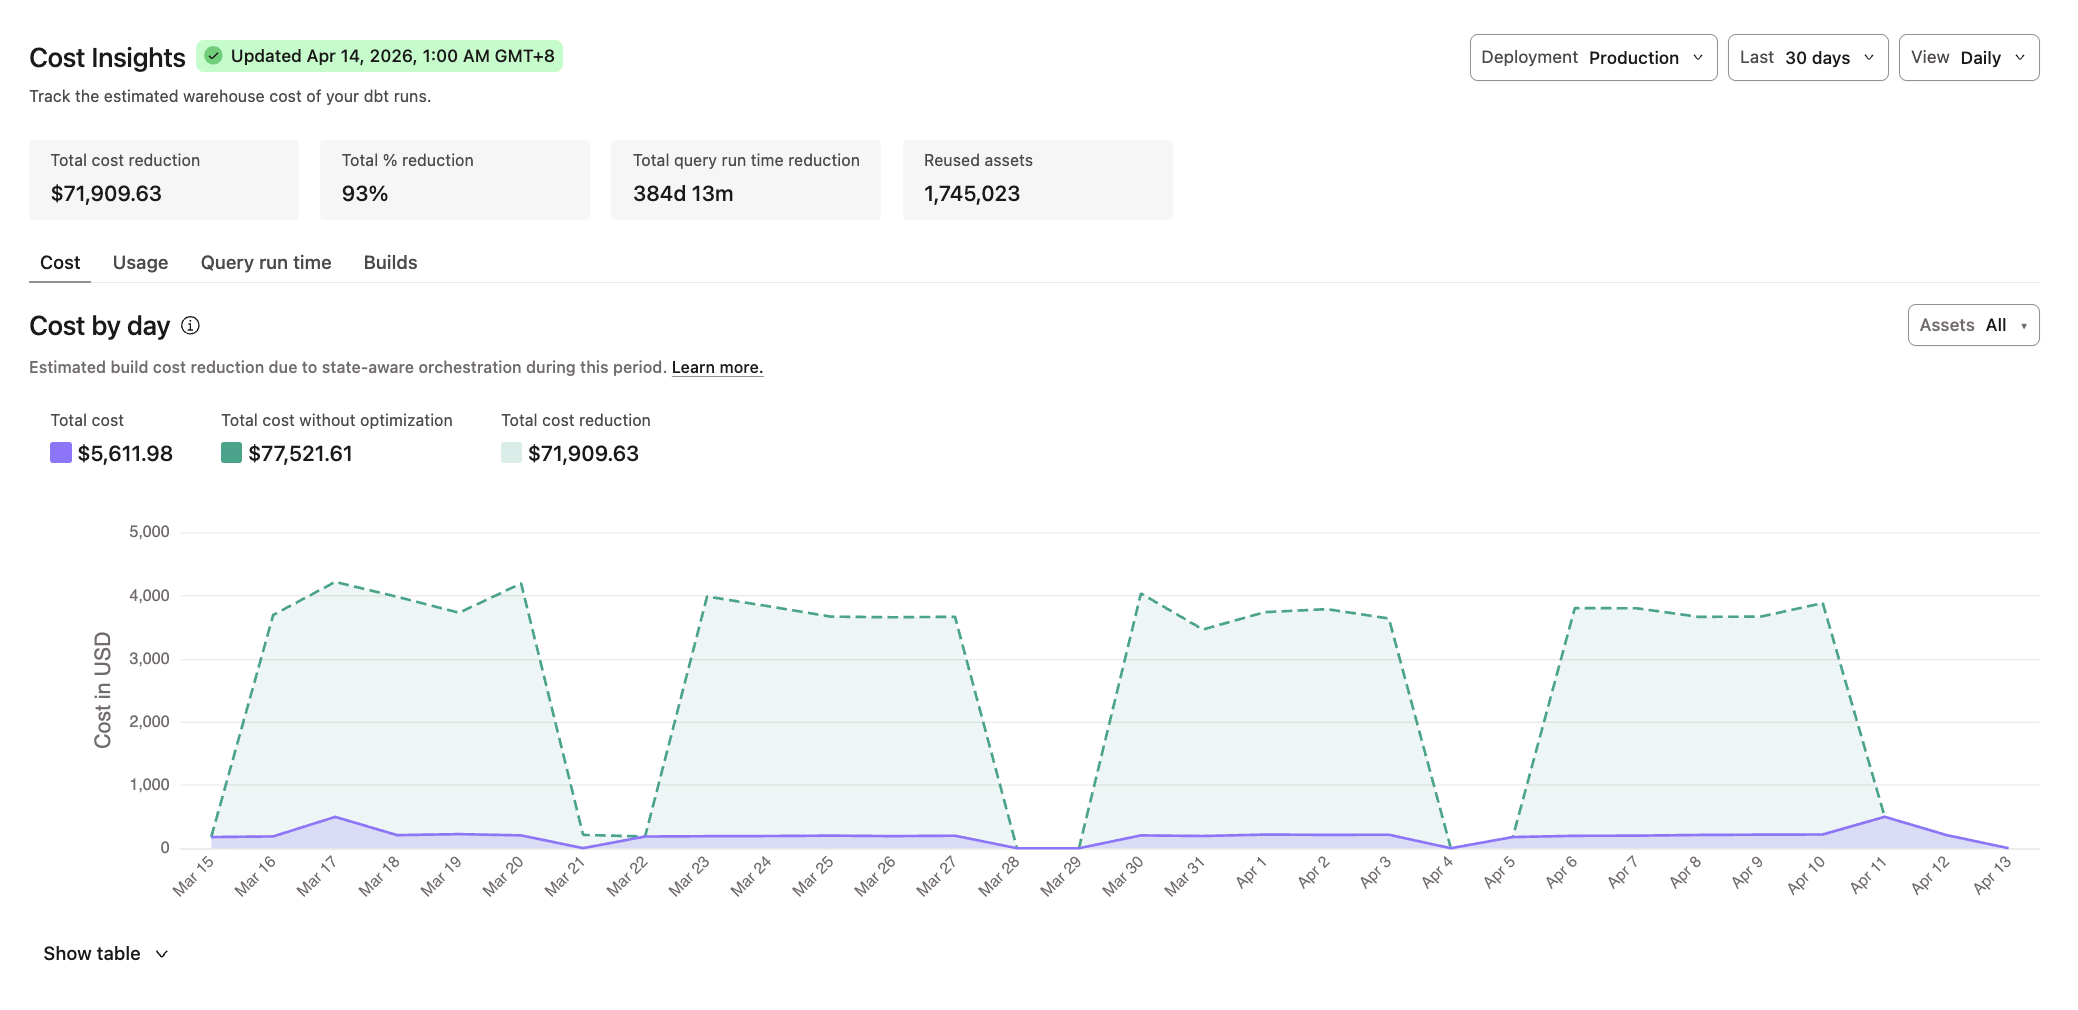
The Cost Insights section in your project dashboard gives you a high-level view of warehouse costs and the impact of optimization through state-aware orchestration.
Access
To go to your project dashboard, select your project in the main menu and click Dashboard.
Key metrics
The project dashboard displays the following metrics that summarize the overall cost and optimization impact for your project:
- Total cost reduction
- Total % reduction
- Total query run time reduction
- Reused assets
Filters
You can customize the cost data you want to view by:
- Deployment type: Production or Staging
- Last: 30 days, 60 days, 90 days, 6 months, or 1 year
- View: Daily, Weekly, or Monthly
- Assets: All, Models, Tests
Visualization tabs
The project dashboard includes the following tabs that help you analyze cost and optimization trends over time.
- Cost: Shows the estimated build cost reduction when using state-aware orchestration.
- Usage: Shows the estimated warehouse usage consumed and the reduction in usage from state-aware orchestration over the selected timeframe. The Usage tab represents generic usage for your warehouse. The specific unit depends on your data warehouse:
- Snowflake: Credits
- BigQuery: Slot hours or bytes scanned (currently combined into one generic usage number)
- Databricks: Databricks Units (DBUs)
- Query run time: Shows the estimated reduction in build time when using state-aware orchestration.
- Builds: Shows total builds split into number of assets rebuilt and assets reused by state-aware orchestration.
Table view
Access the table view by clicking Show table, which provides detailed optimization data such as models reused, usage reduction, and cost reduction.
When viewing the table, you can export the data as a CSV file using the Download button.
Model performance in Catalog
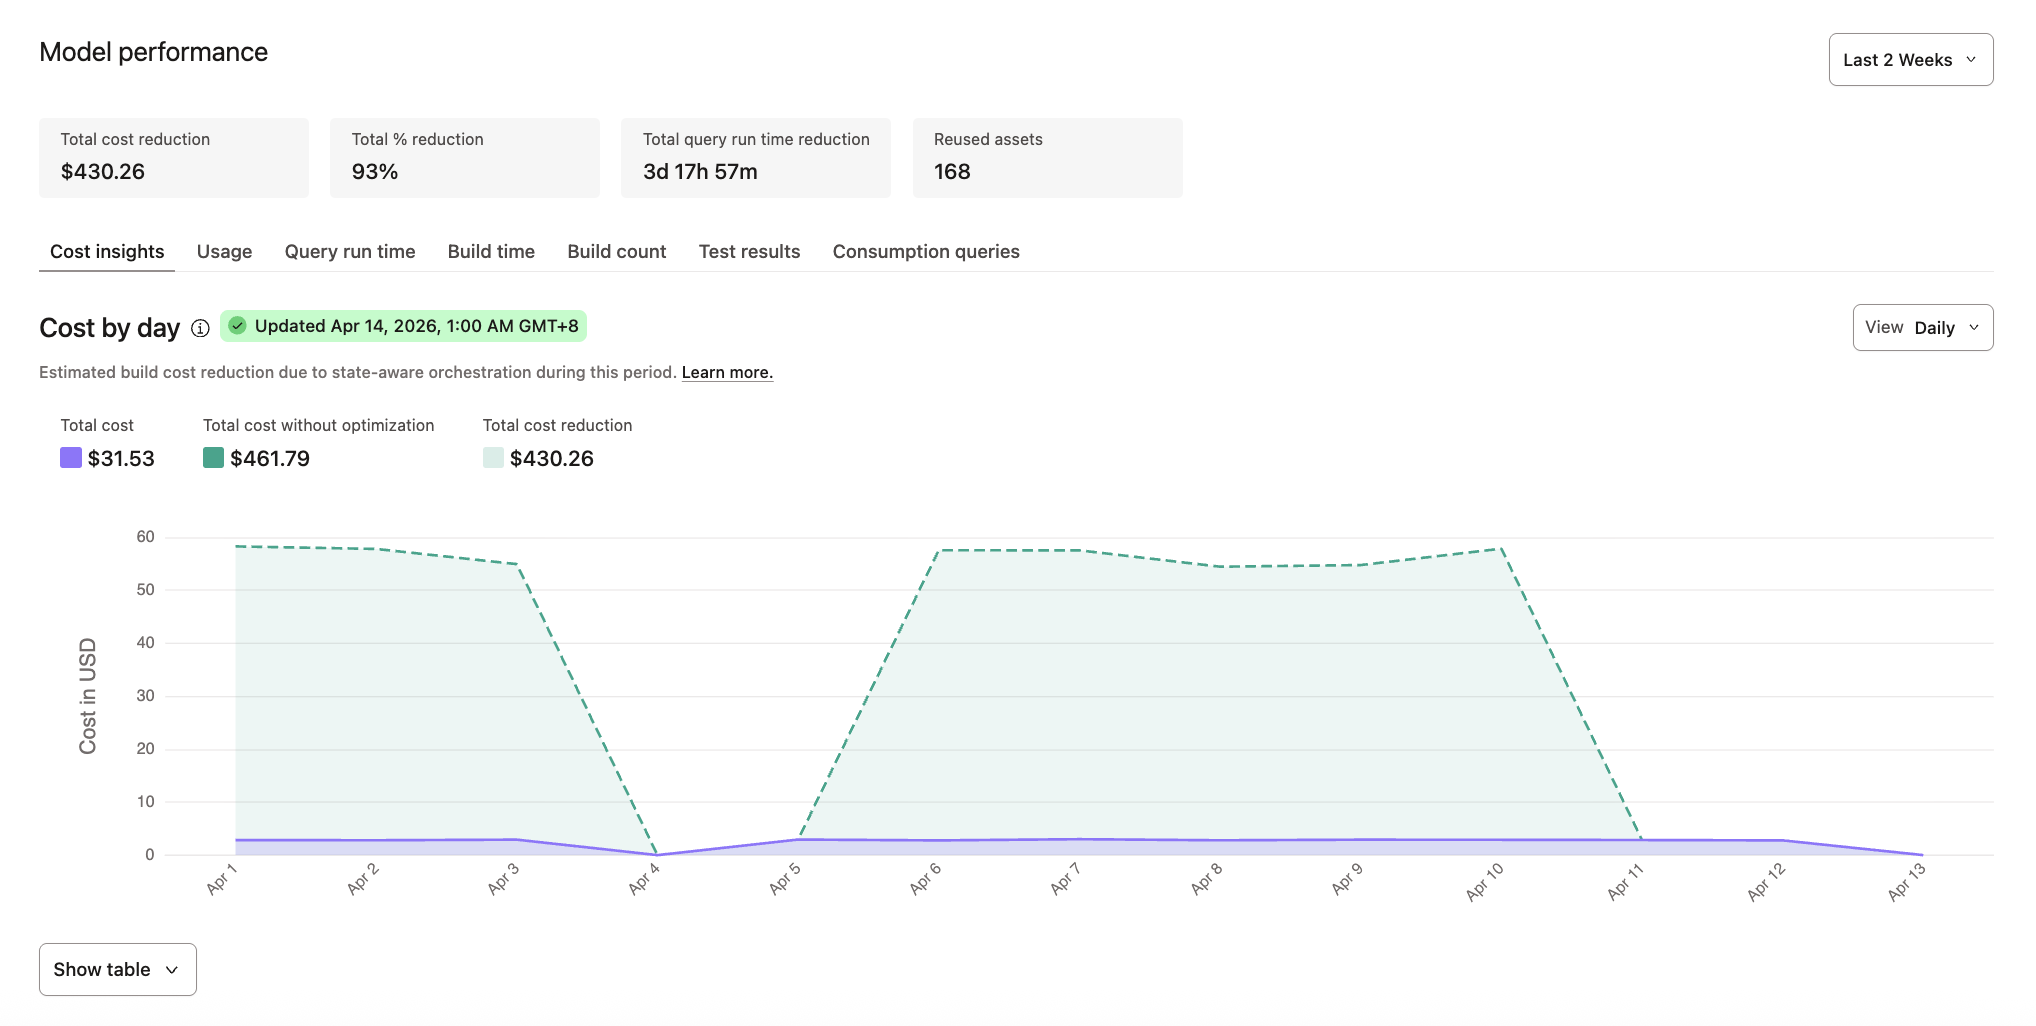
The Model performance section in Catalog displays historical trends to help you identify optimization opportunities and understand model resource consumption.
Access
To access model performance data:
- From the main menu, go to Catalog.
- Click your project from the file tree.
- Navigate to the model whose cost data you want to view. You can search for it or click Models under Project assets in the sidebar to view all available models in the project.
- Go to the the Performance tab on the model's details page.
Key metrics
The Model performance section displays the following metrics that summarize the overall cost and optimization impact for your project:
- Total cost reduction
- Total % reduction
- Total query run time deduction
- Reused assets (when state-aware orchestration is enabled)
Filters
Use the time period filter to customize the data you want to view: from the last 3 months up to the last 1 week.
For Cost insights, Usage, and Query run time tabs, you can set the view granularity by Daily, Weekly, or Monthly.
Visualization tabs
- Cost insights: Shows the estimated warehouse costs incurred by this model and cost reduction from state-aware orchestration.
- Usage: Shows the estimated warehouse usage consumed by this model over time. The Usage tab represents generic usage for your warehouse. The specific unit depends on your data warehouse:
- Snowflake: Credits
- BigQuery: Slot hours or bytes scanned (currently combined into one generic usage number)
- Databricks: Databricks Units (DBUs)
- Query run time: Shows the estimated query execution time and the reduction in run duration from state-aware orchestration.
- Build time: Shows average execution time for the model and how it trends over the selected period.
- Build count: Tracks how many times the model was built or reused, including any failures or errors.
- Test results: Displays test execution outcomes and pass/fail rates for tests on this model.
- Consumption queries: Shows queries running against this model, helping you understand downstream usage patterns.
Table view
For Cost insights, Usage, and Query run time tabs, you can access the table view by clicking Show table, which provides detailed optimization data such as models reused, usage reduction, and cost reduction.
When viewing the table, you can export the data as a CSV file using the Download button.
Chart interactions
For Build time and Build count tabs:
- Click on any data point in the charts to see a detailed table listing all job runs for that day.
- Each row in the table provides a direct link to the run details if you want to investigate further.
Job details
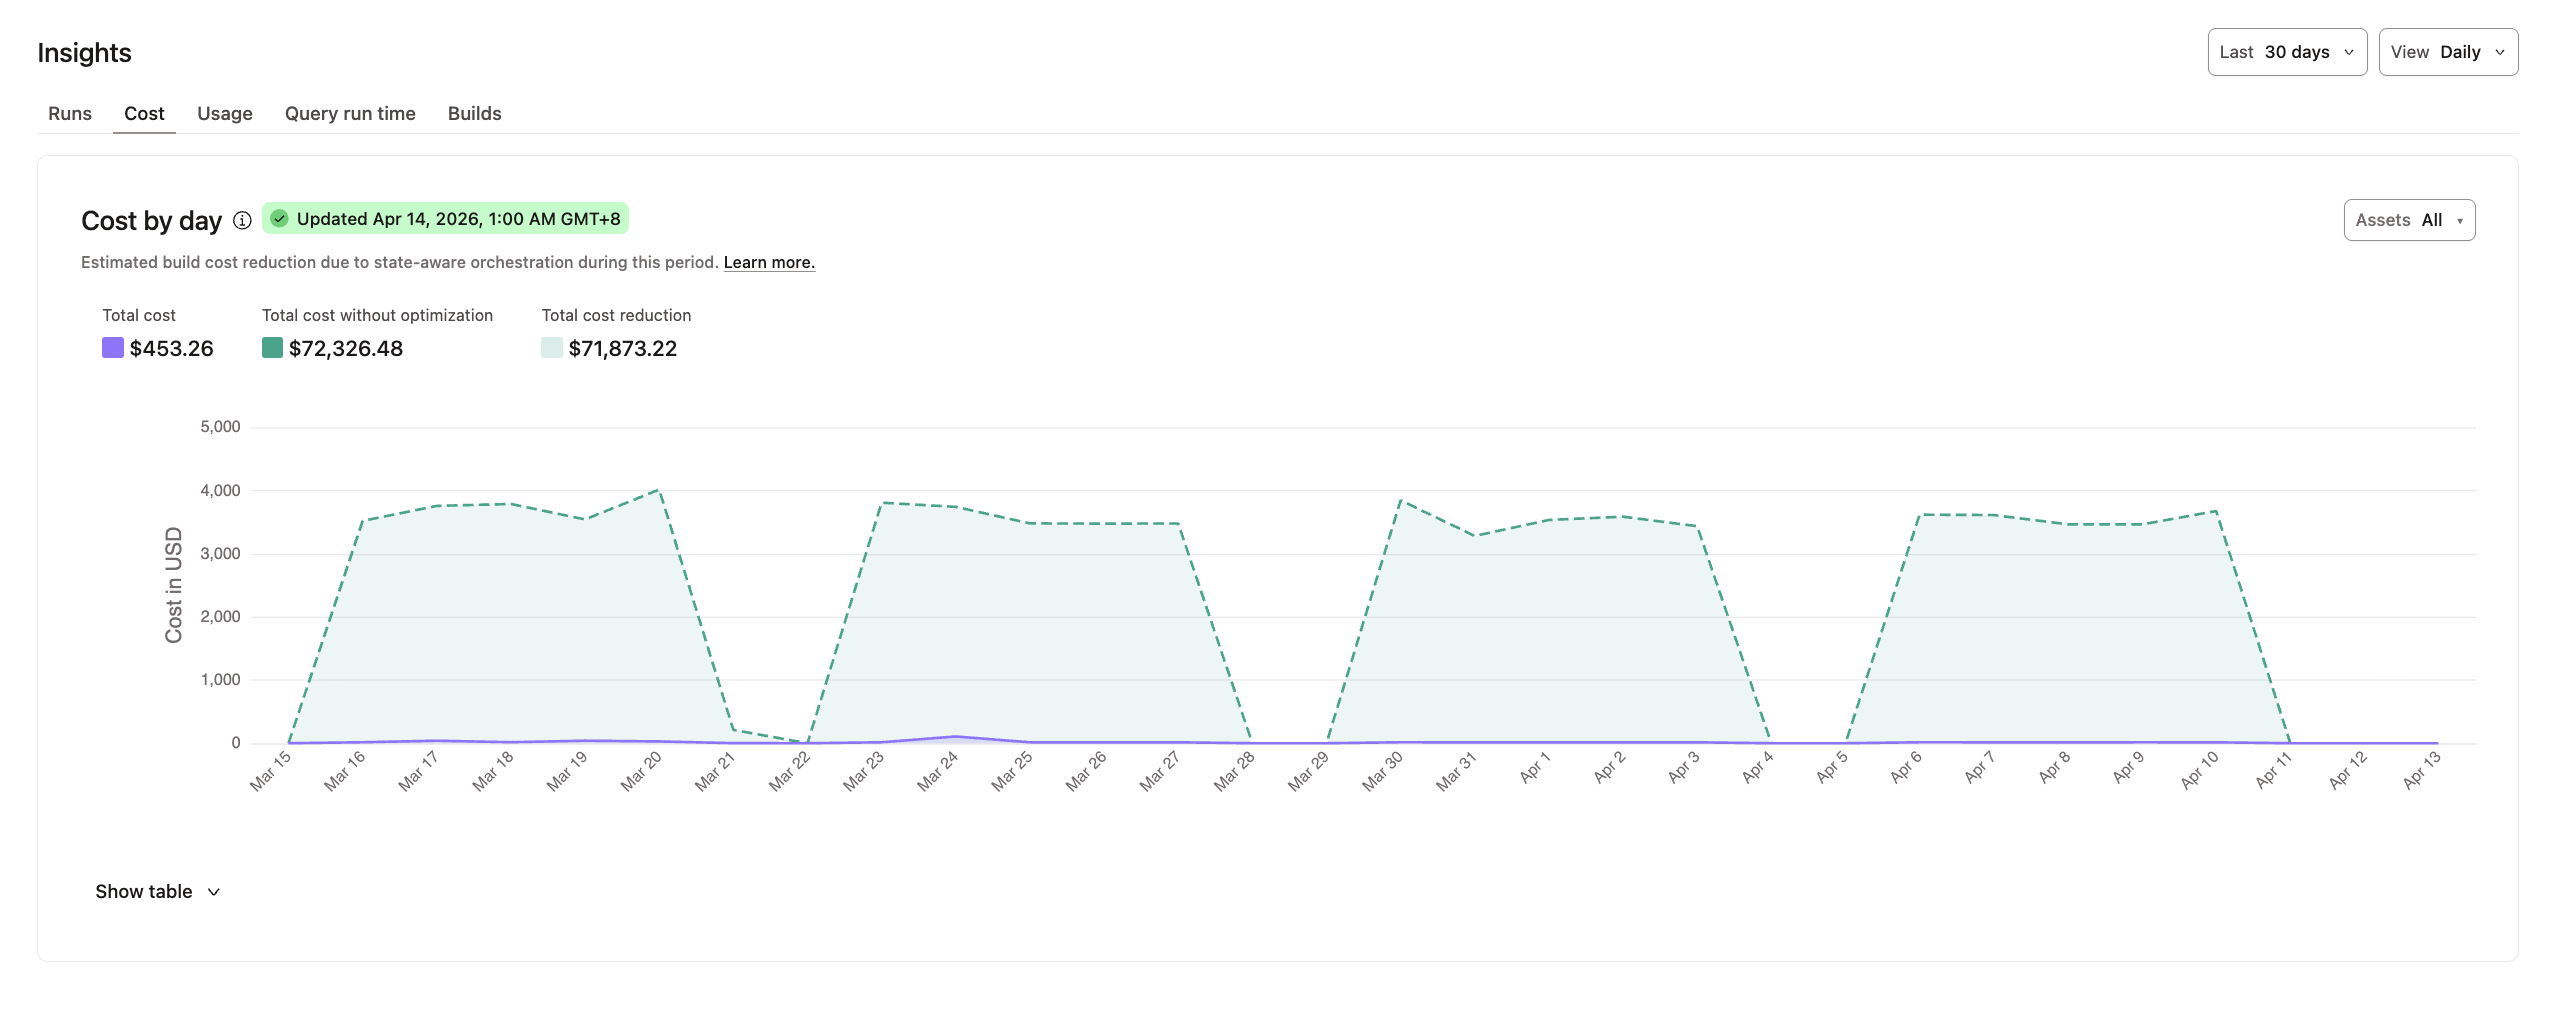
The Insights section on the Job details page provides cost and performance data for individual jobs.
Access
To access job details, select your project in the main menu and go to Orchestration > Jobs. Select the job whose cost data you want to view.
Filters
For the Runs tab, you can use the Last filter to view data from the past week, 14 days, or 30 days.
For Cost, Usage, Query run time, and Builds tabs, you can customize the cost data you want to view by:
- Last: 30 days, 60 days, 90 days, 6 months, or 1 year
- View: Daily, Weekly, Monthly
- Assets: All, Models, Tests
Visualization tabs
- Runs: Displays the success rate and run duration in minutes for recent runs. You can select a time period with options for Last week, Last 14 days, and Last 30 days.
- Cost: Shows the estimated build cost reduction when using state-aware orchestration.
- Usage: Shows the estimated warehouse usage consumed and the reduction in usage from state-aware orchestration over the selected timeframe. The Usage tab represents generic usage for your warehouse. The specific unit depends on your data warehouse:
- Snowflake: Credits
- BigQuery: Slot hours or bytes scanned (currently combined into one generic usage number)
- Databricks: Databricks Units (DBUs)
- Query run time: Shows the estimated query execution time and the reduction in run duration from state-aware orchestration.
- Builds: Shows the number of assets built versus reused by state-aware orchestration.
Table view
For Cost, Usage, Query run time, and Builds tabs, you can access the table view by clicking Show table, which provides detailed optimization data such as models reused, usage reduction, and cost reduction.
When viewing the table, you can export the data as a CSV file using the Download button.
Was this page helpful?
This site is protected by reCAPTCHA and the Google Privacy Policy and Terms of Service apply.


