# Data health tile
dbt platform | Enterprise, Enterprise+
With data health tiles, stakeholders will get an at-a-glance confirmation on whether the data they’re looking at is stale or degraded. It allows teams to immediately go back into Catalog to see more details and investigate issues.
The data health tile:
* Distills [data health signals](./data-health-signals.md) for data consumers.
* Deep links you into Catalog where you can further dive into upstream data issues.
* Provides richer information and makes it easier to debug.
* Revamps the existing, [job-based tiles](#job-based-data-health).
Data health tiles rely on [exposures](../build/exposures.md) to surface data health signals in your dashboards. An exposure defines how specific outputs — like dashboards or reports — depend on your data models. Exposures in dbt can be configured in two ways:
* Manual — Defined [manually](../build/exposures.md#declaring-an-exposure) and explicitly in your project’s YAML files.
* Automatic — Pulled automatically for supported dbt integrations. dbt automatically [creates and visualizes downstream exposures](../platform-integrations/downstream-exposures.md), removing the need for manual YAML definitions. These downstream exposures are stored in dbt’s metadata system, appear in [Catalog](./explore-projects.md), and behave like manual exposures, however they don’t exist in YAML files.
[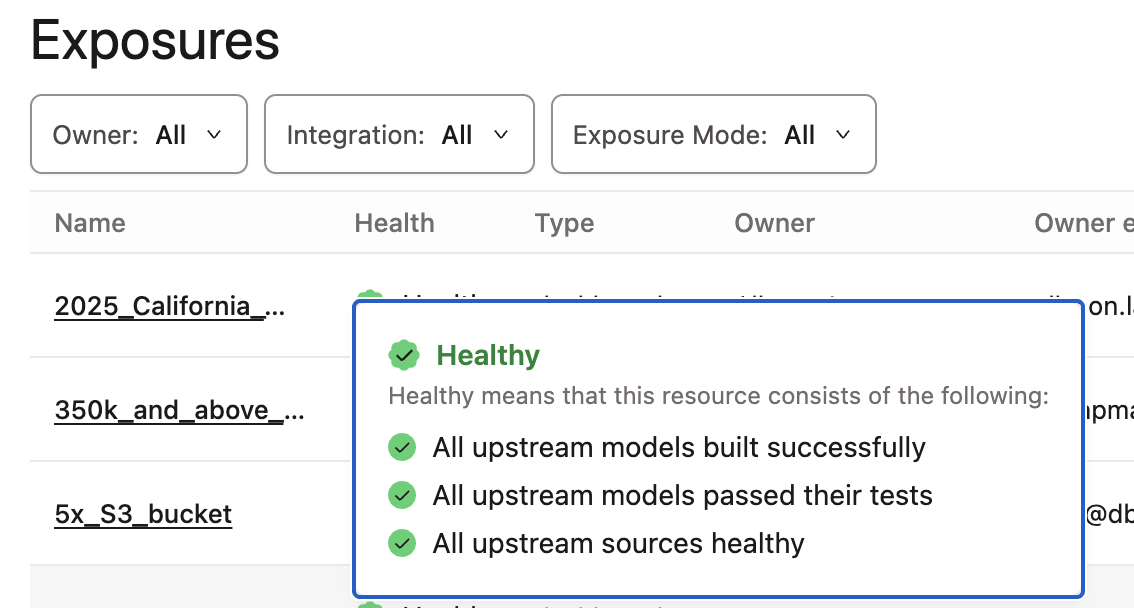](#)Example of passing Data health tile in your dashboard.
[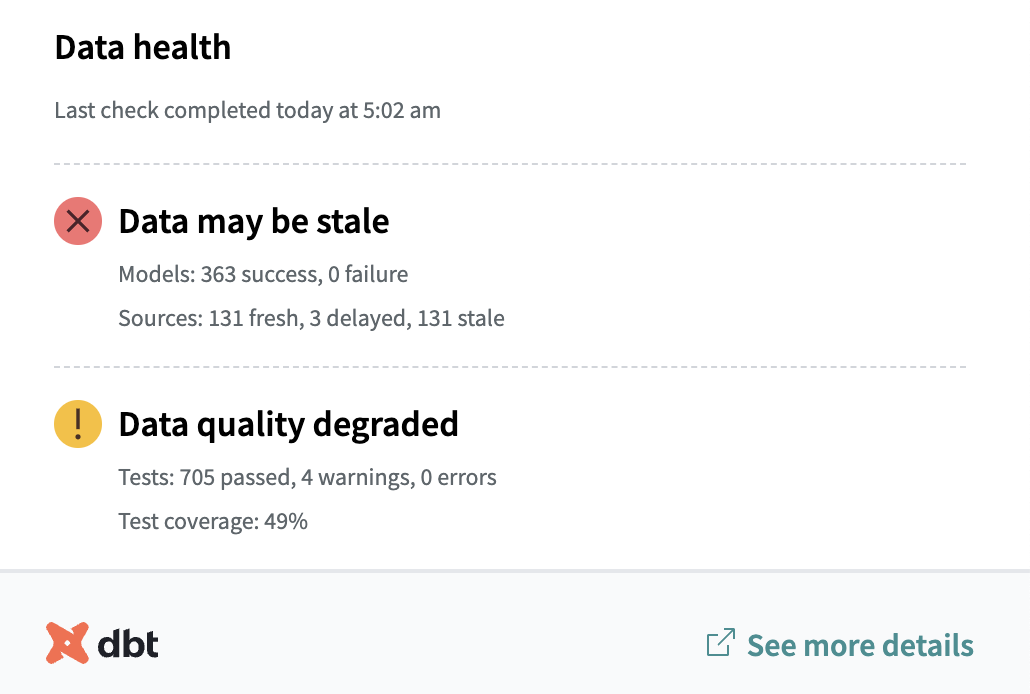](#)Embed data health tiles in your dashboards to distill data health signals for data consumers.
## Prerequisites
* You must have a dbt account on an [Enterprise-tier plan](https://www.getdbt.com/pricing/).
* You must be an account admin to set up [service tokens](../dbt-apis/service-tokens.md#permissions-for-service-account-tokens).
* You must have [develop permissions](../platform/manage-access/seats-and-users.md).
* You have [exposures](../build/exposures.md) defined in your project:
* If using manual exposures, they must be explicitly defined in your YAML files.
* If using automatic downstream exposures, ensure your BI tool is [configured](../platform-integrations/downstream-exposures-tableau.md) with dbt.
* You have [source freshness](../deploy/source-freshness.md) enabled in the job that generates this exposure.
* The exposure used for the data health tile must have the [`type` property](../build/exposures.md#available-properties) set to `dashboard`. Otherwise, you won't be able to view the **Embed data health tile in your dashboard** dropdown in Catalog.
## View exposure in dbt Catalog
First, be sure to enable [source freshness](../deploy/source-freshness.md) in the job that generates this exposure.
1. Navigate to Catalog by clicking on the **Catalog** link in the navigation.
2. In the main **Overview** page, go to the left navigation.
3. Click on **Exposures** to view the [exposures](../build/exposures.md) list.
4. Select a dashboard exposure and go to the **General** tab to view the data health information.
5. In this tab, you’ll see:
* The exposure name at the top of the page.
* The resource type (for example, **Exposure**) and an **Updated at** timestamp.
* A **Data health** section that shows when the **Last check completed** (relative time since the check ran).
* A freshness summary (for example, **Data is fresh**) and a breakdown of upstream **Sources** (fresh, delayed, stale, skipped, outdated, unconfigured).
* A quality summary (for example, **Data quality passed**) and a breakdown of upstream **Models** and **Tests**.
6. You can click the **Open in Dashboard** button in the upper right to immediately view this in your analytics tool.
[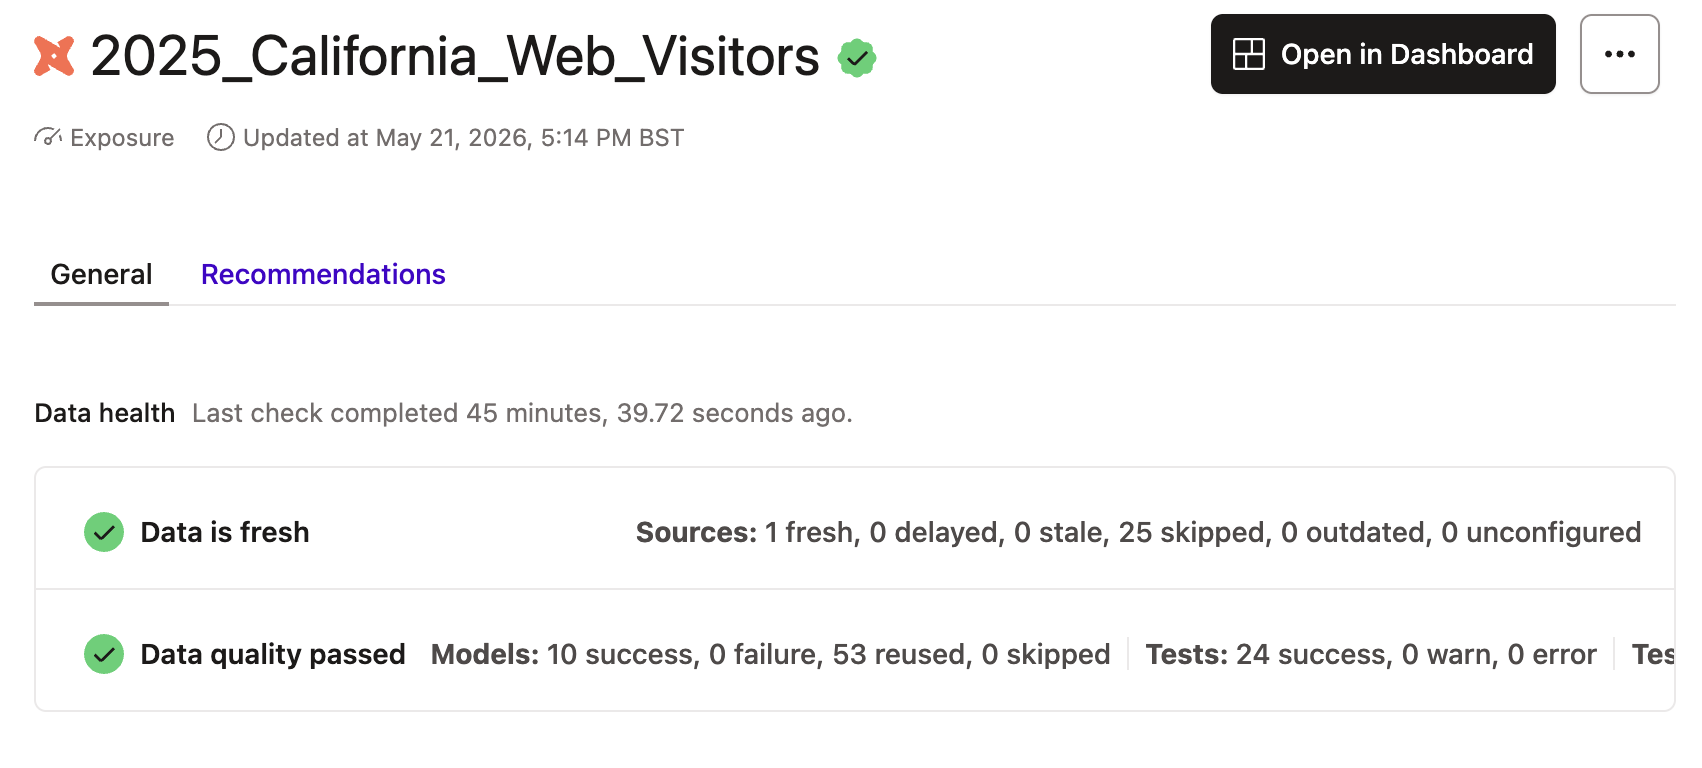](#)View an exposure in dbt Catalog.
## Embed in your dashboard
Once you’ve navigated to the exposure in Catalog, you’ll need to set up your data health tile and [service token](../dbt-apis/service-tokens.md). You can embed data health tile to any analytics tool that supports URL or iFrame embedding.
Follow these steps to set up your data health tile:
1. Go to **Account settings** in dbt.
2. Select **API tokens** in the left sidebar and then **Service tokens**.
3. Click on **Create service token** and give it a name.
4. Select the [**Metadata Only**](../dbt-apis/service-tokens.md) permission. This token will be used to embed the tile in your dashboard in the later steps.
[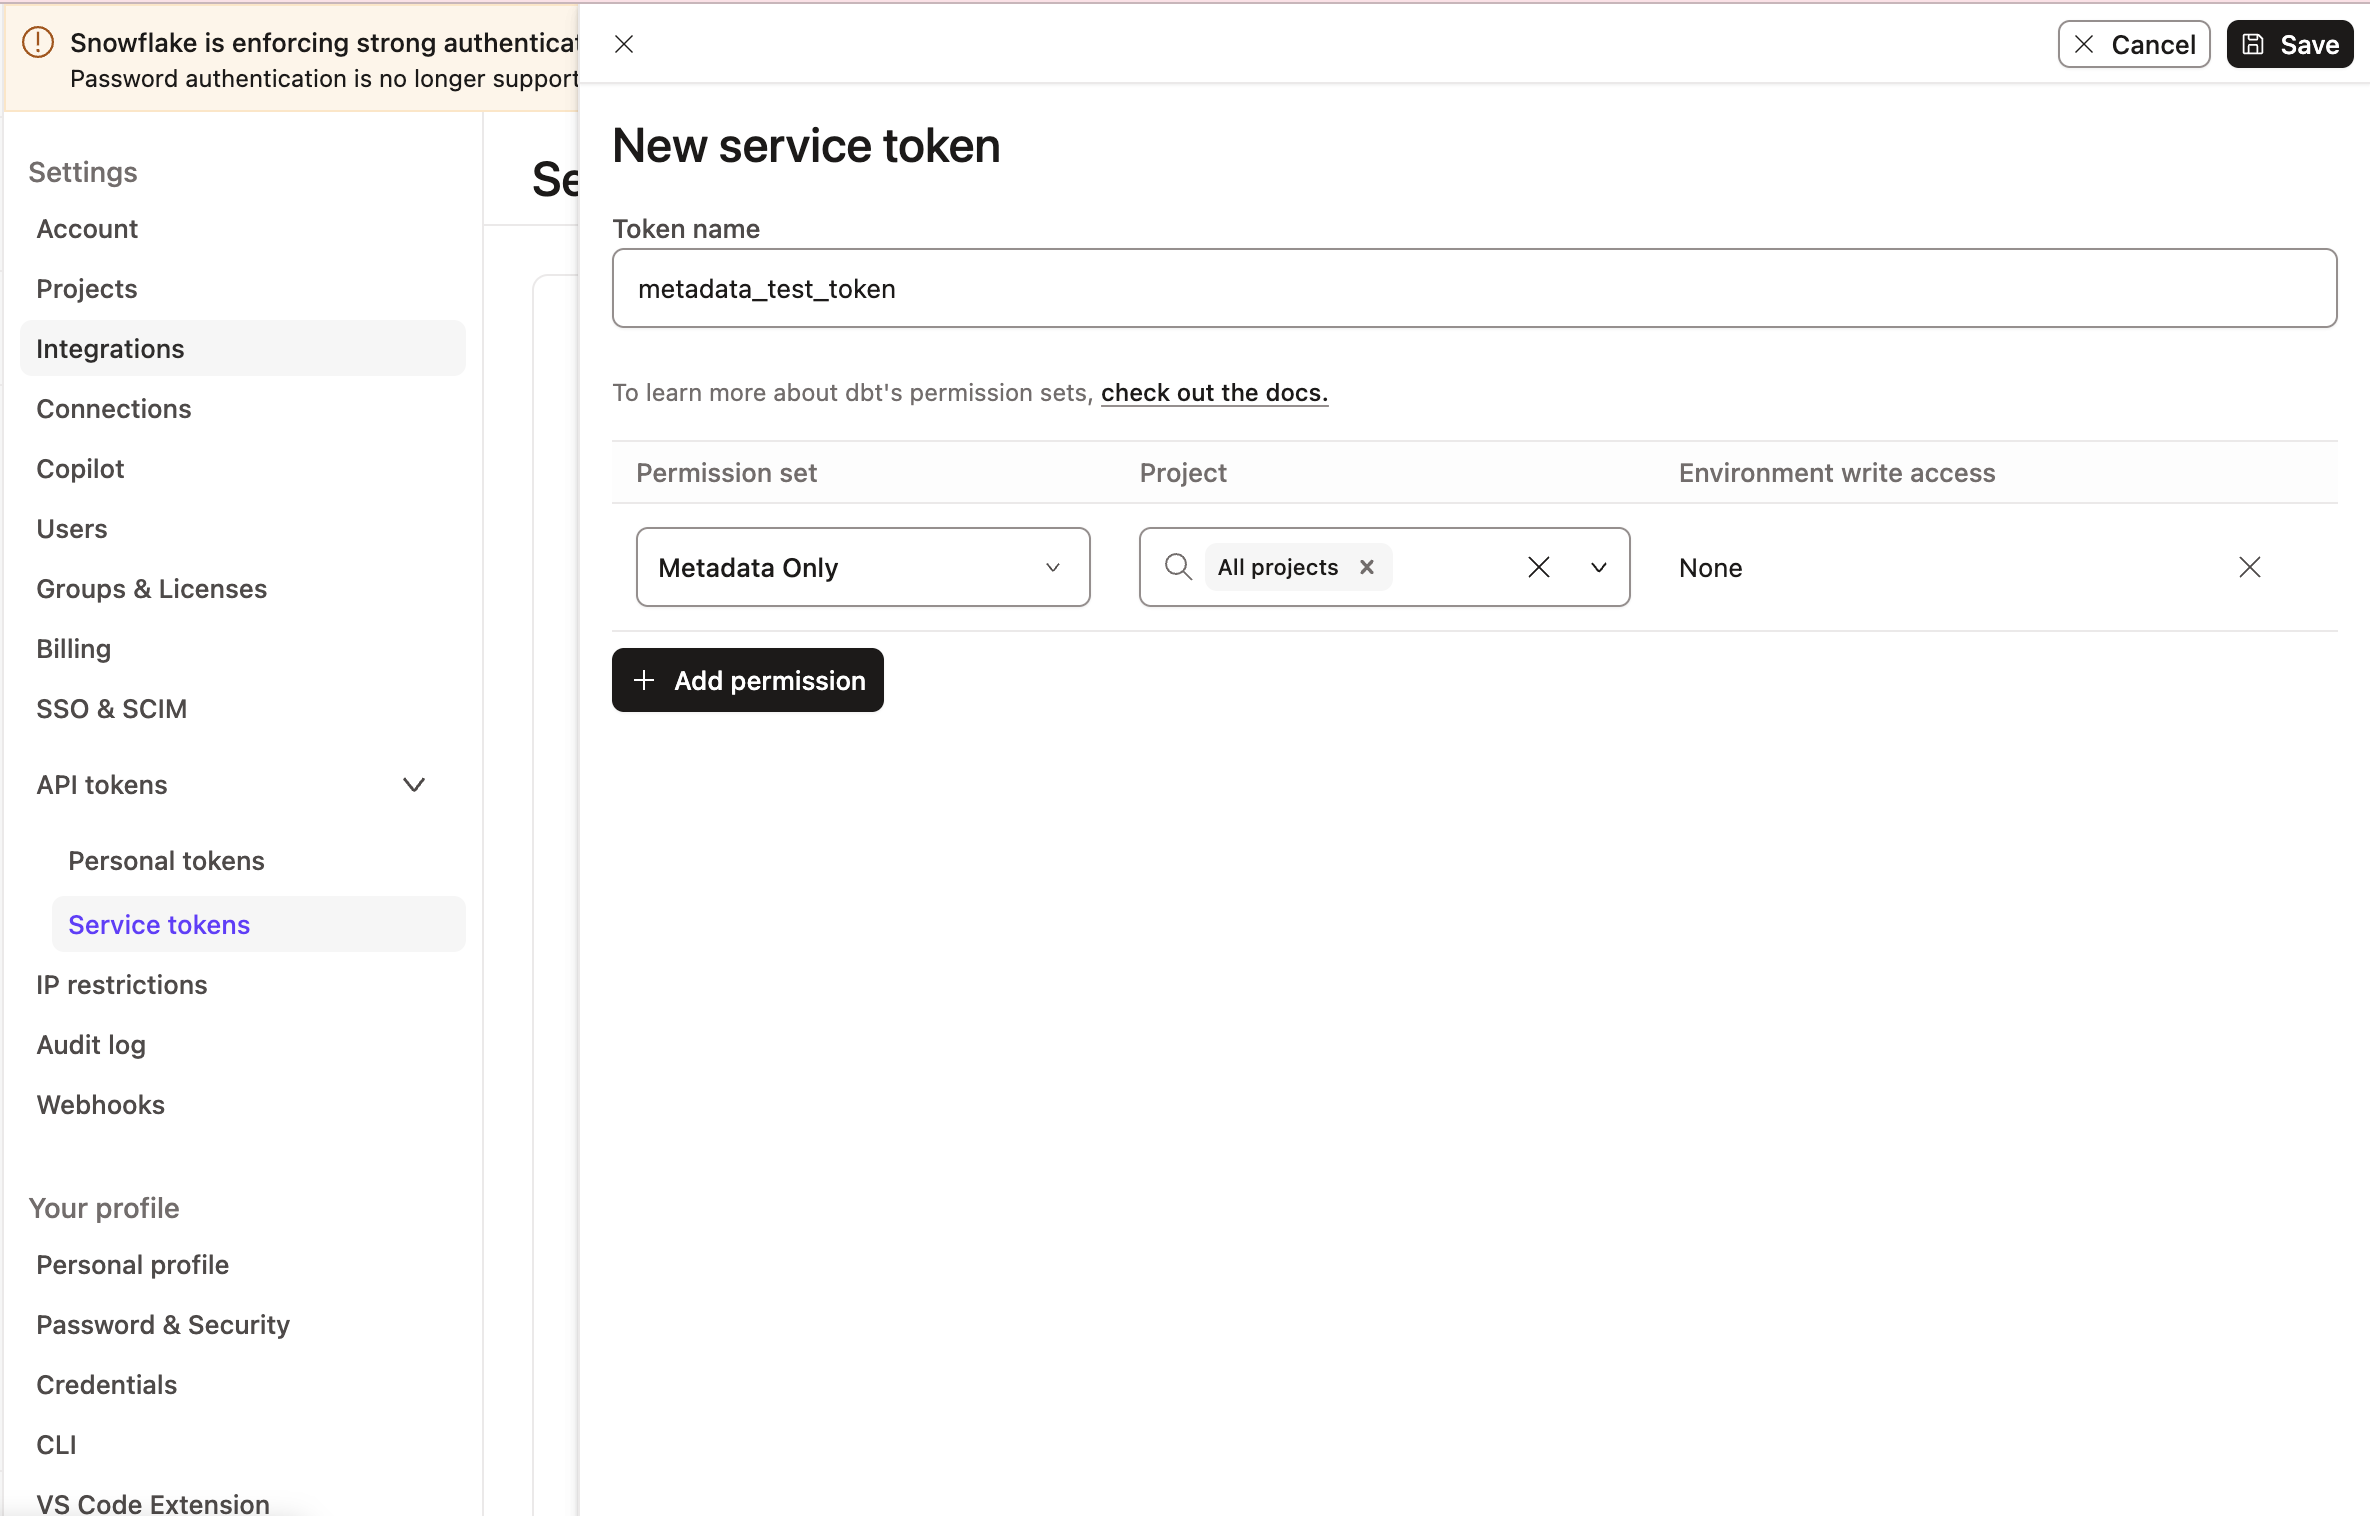](#)Set up your dashboard status tile and service token to embed a data health tile
5. Copy the **Metadata Only** token and save it in a secure location. You'll need it token in the next steps.
6. Navigate back to Catalog and select an exposure.
tip
The exposure used for the data health tile must have the [`type` property](../build/exposures.md#available-properties) set to `dashboard`. Otherwise, you won't be able to view the **Embed data health tile in your dashboard** dropdown in Catalog.
7. Below the **Data health** section, expand on the toggle for instructions on how to embed the exposure tile (if you're an account admin with develop permissions).
8. In the expanded toggle, you'll see a text field where you can paste your **Metadata Only token**.
[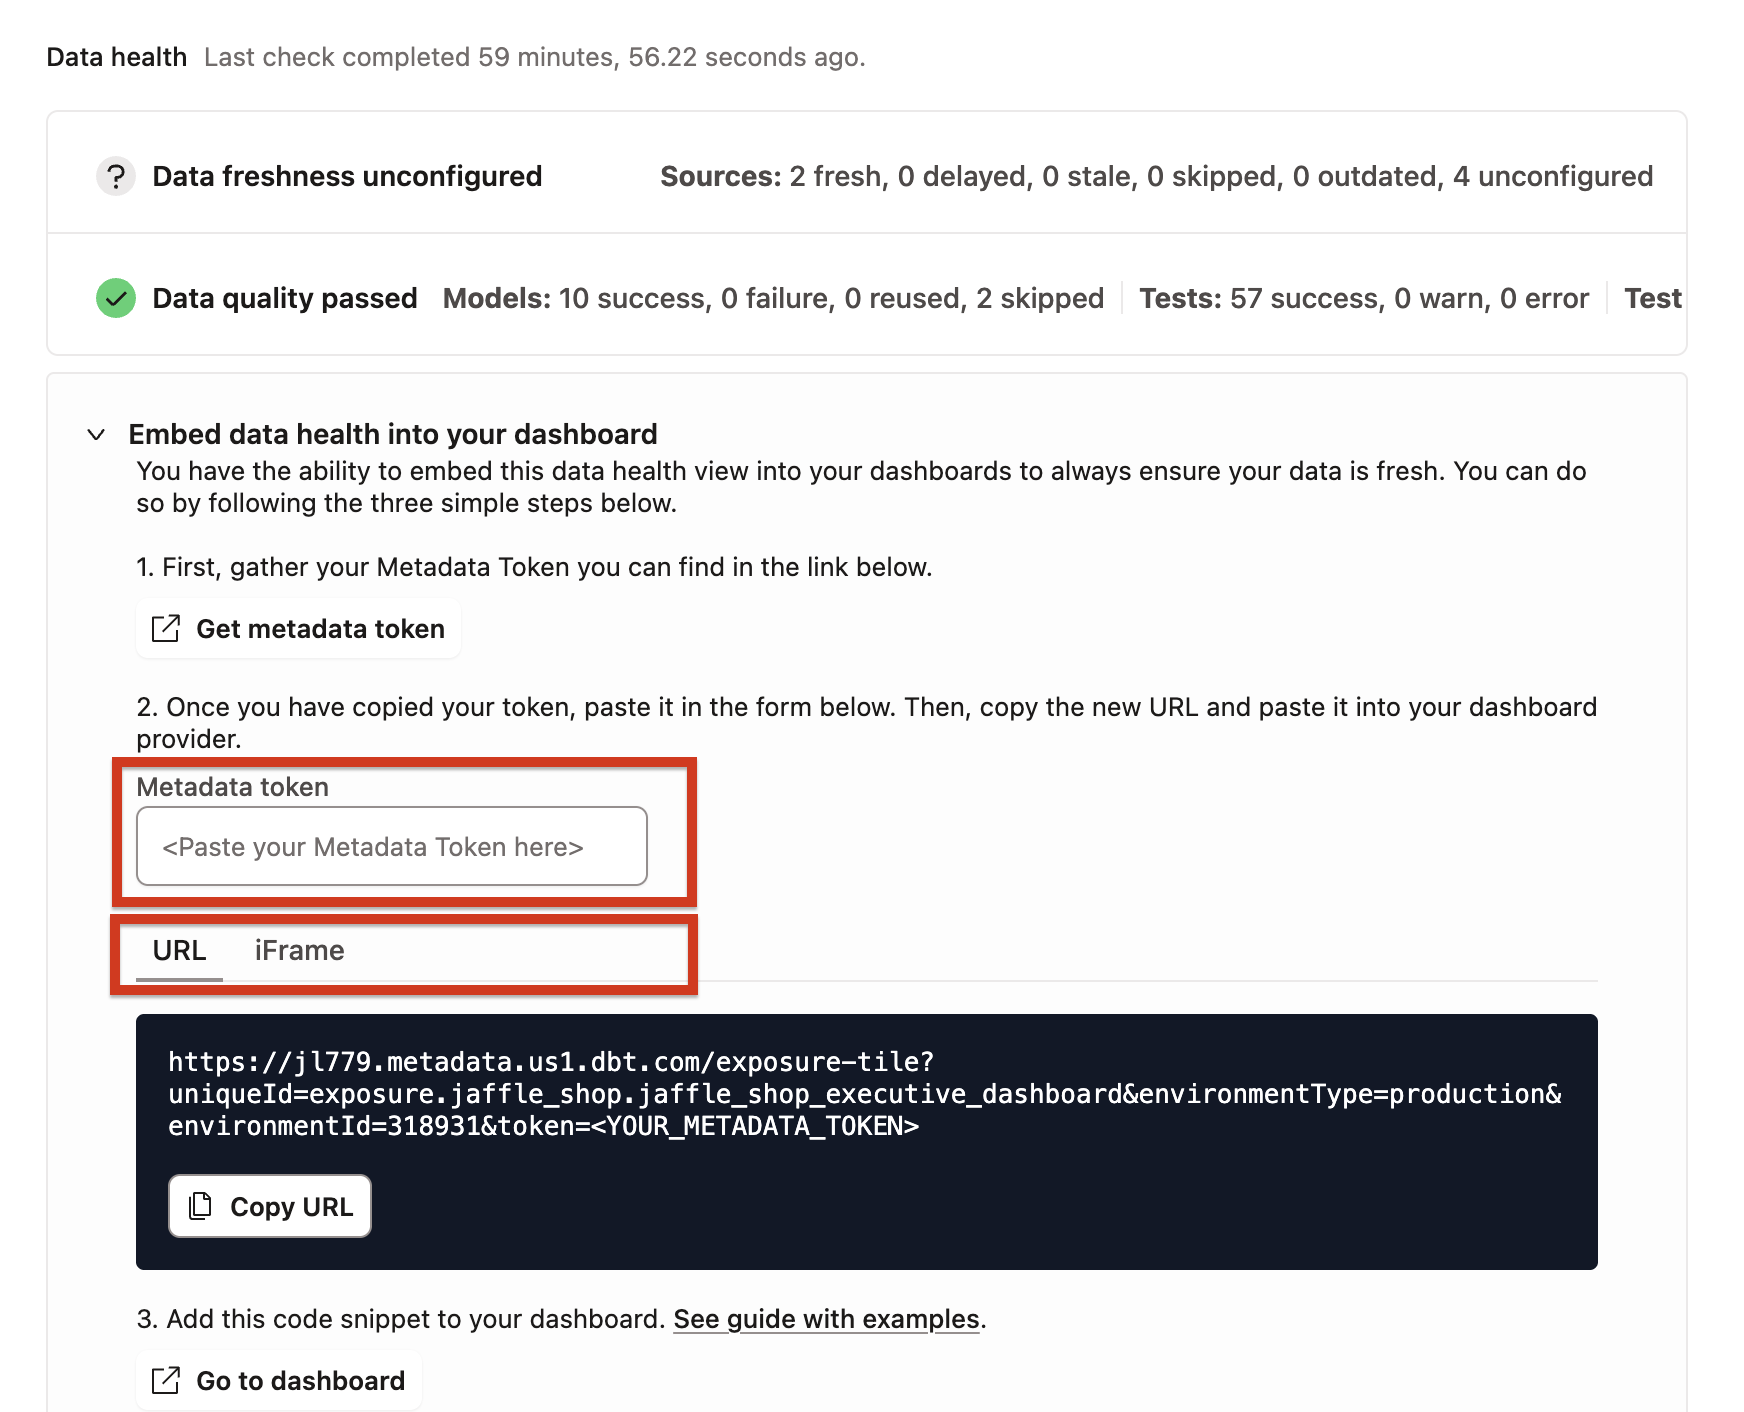](#)Expand the toggle to embed data health tile into your dashboard.
9. Once you’ve pasted your token, you can select either **URL** or **iFrame** depending on which you need to add to your dashboard.
If your analytics tool supports iFrames, you can embed the dashboard tile within it.
## Examples
The following examples show how to embed the data health tile in Omni, PowerBI, Tableau, and Sigma.
### Omni example
Follow these steps to embed the data health tile in [Omni](https://omni.co/):
[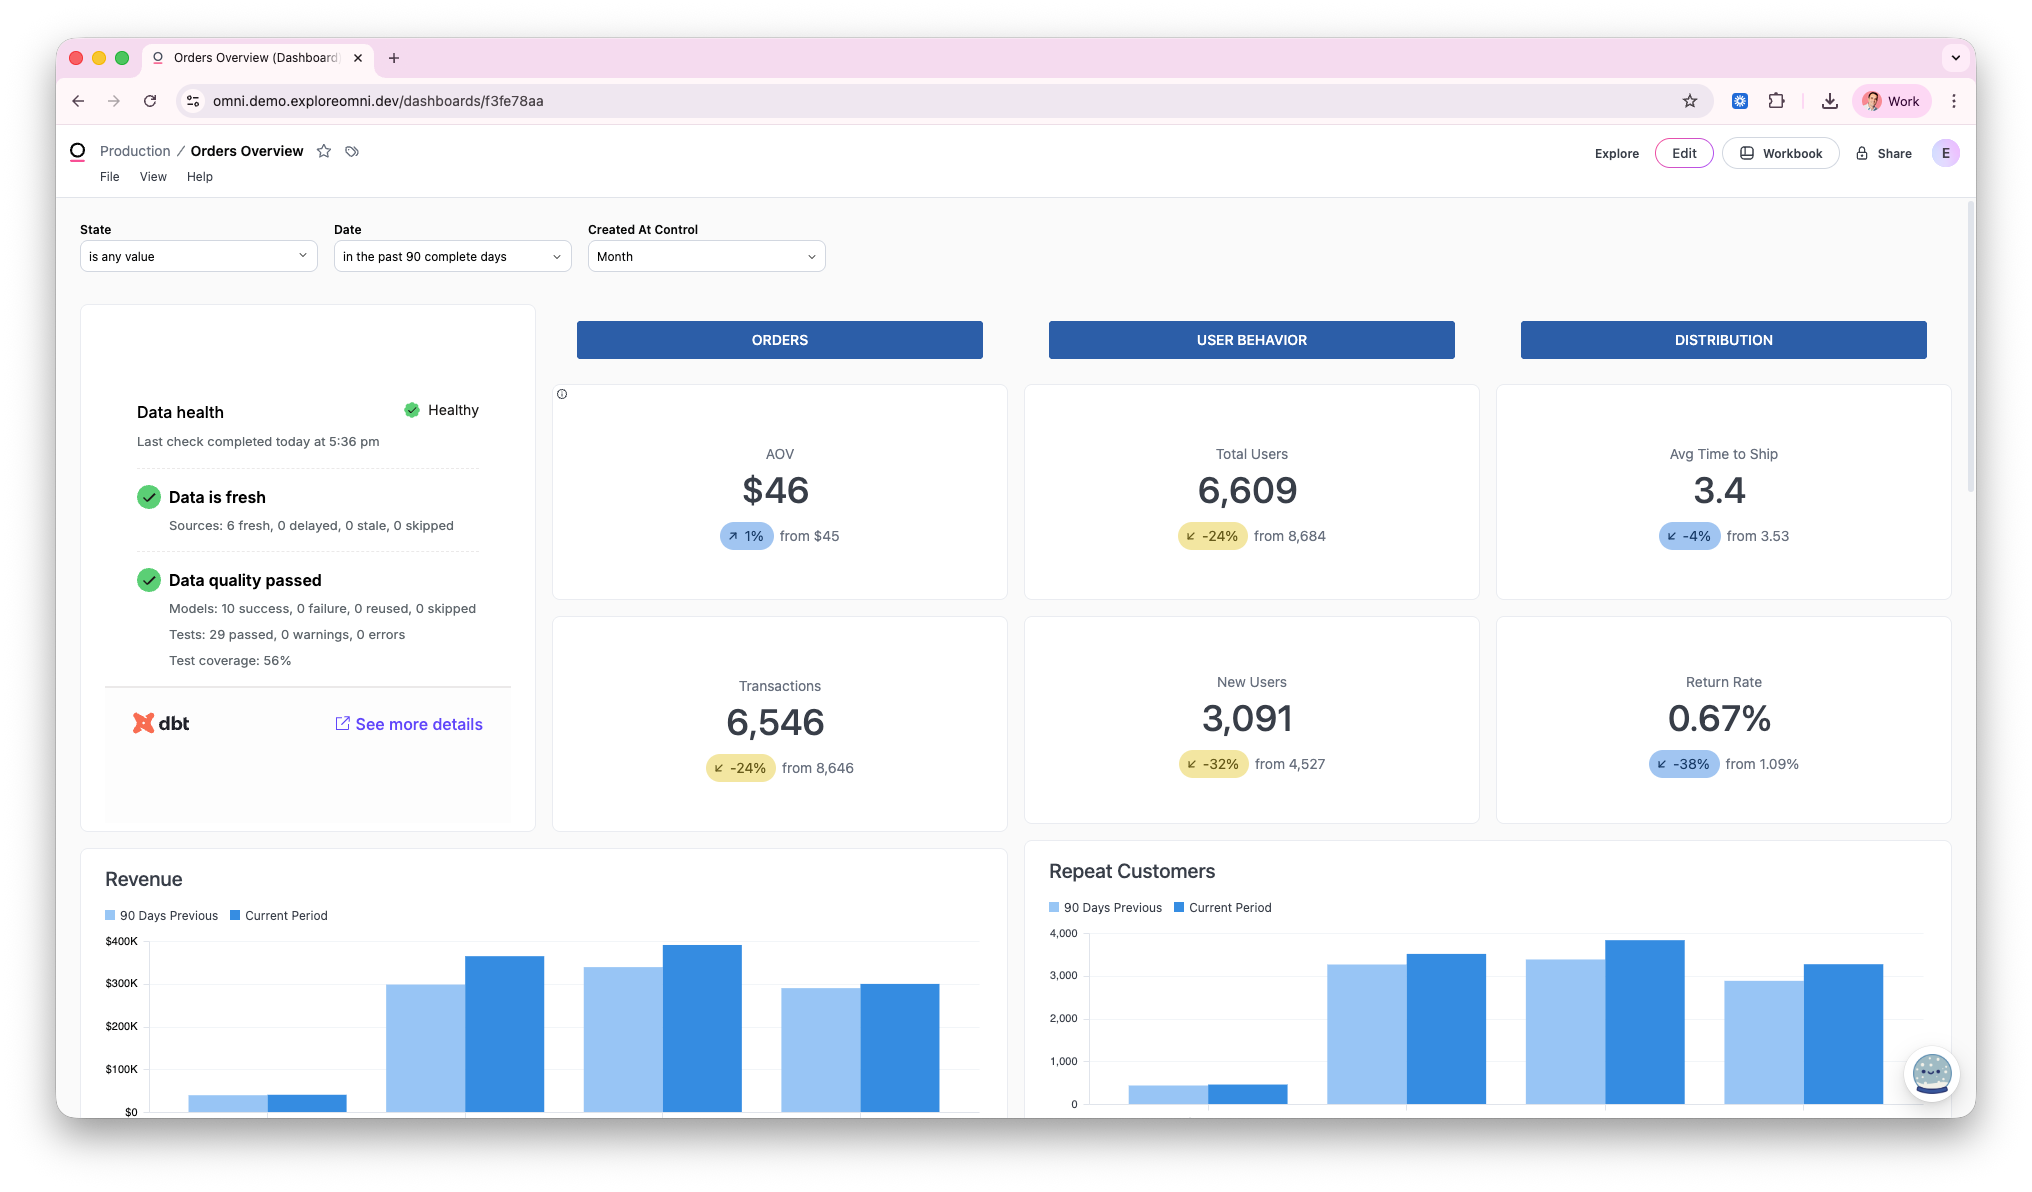](#)Embed data health tile in Omni
1. Create a dashboard in Omni.
2. Copy the iFrame snippet available in Catalog's **Data health** section, under the **Embed data health into your dashboard** toggle.
3. Add a new Text or Markdown [element](https://docs.omni.co/visualize-present/dashboards/text-markdown) in your Dashboard with the code from step 2, it should be in the following format:
```html/text
```
4. Save the tile and your Omni dashboard should now have a dbt platform hosted data health tile that is automatically updated based on the state of your dbt environment.
### PowerBI example
You can embed the data health tile iFrame in PowerBI using PowerBI Pro Online, Fabric PowerBI, or PowerBI Desktop.
[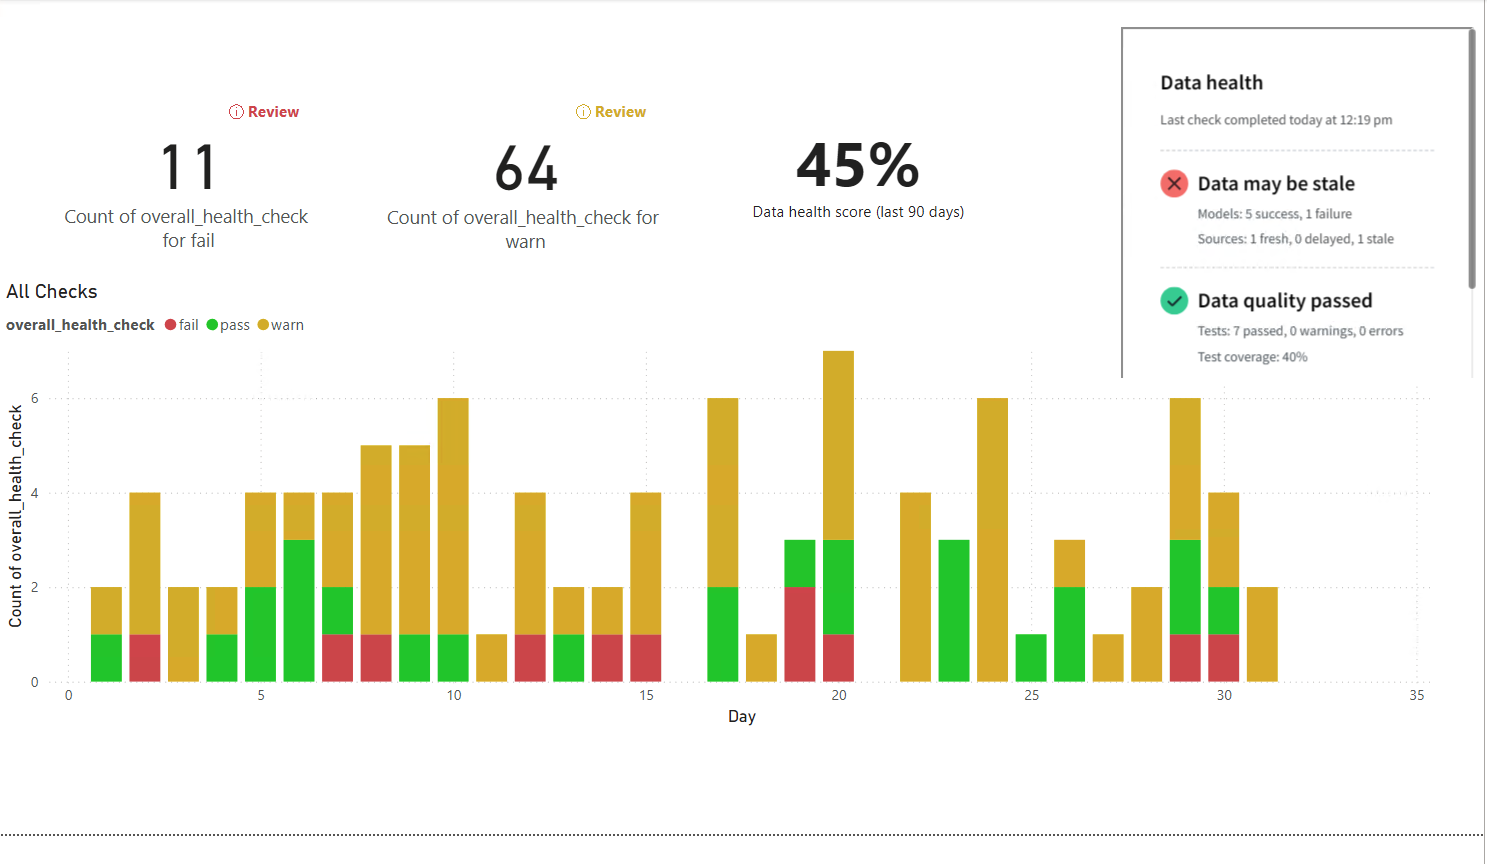](#)Embed data health tile iFrame in PowerBI
Follow these steps to embed the data health tile in PowerBI:
1. Create a dashboard in PowerBI and connect to your database to pull in the data.
2. Create a new PowerBI measure by right-clicking on your **Data**, **More options**, and then **New measure**.
[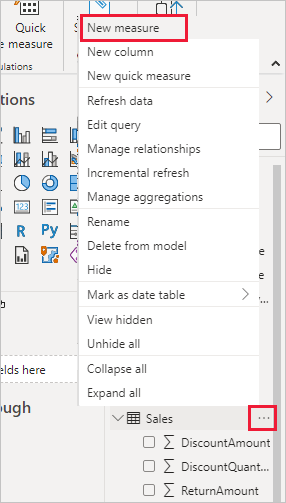](#)Create a new PowerBI measure.
3. Navigate to Catalog, select the exposure, and expand the [**Embed data health into your dashboard**](./data-tile.md#embed-in-your-dashboard) toggle.
4. Go to the **iFrame** tab and copy the iFrame code. Make sure the Metadata Only token is already set up.
5. In PowerBI, paste the iFrame code you copied into your measure calculation window. The iFrame code should look like this:
```html/text
```
[](#)In the 'Measure tools' tab, replace your values with the iFrame code.
6. PowerBI desktop doesn't support HTML rendering by default, so you need to install an HTML component from the PowerBI Visuals Store.
7. To do this, go to **Build visuals** and then **Get more visuals**.
8. Login with your PowerBI account.
9. There are several third-party HTML visuals. The one tested for this guide is [HTML content](https://appsource.microsoft.com/en-us/product/power-bi-visuals/WA200001930?tab=Overview). Install it, but please keep in mind it's a third-party plugin not created or supported by dbt Labs.
10. Drag the metric with the iFrame code into the HTML content widget in PowerBI. This should now display your data health tile.
[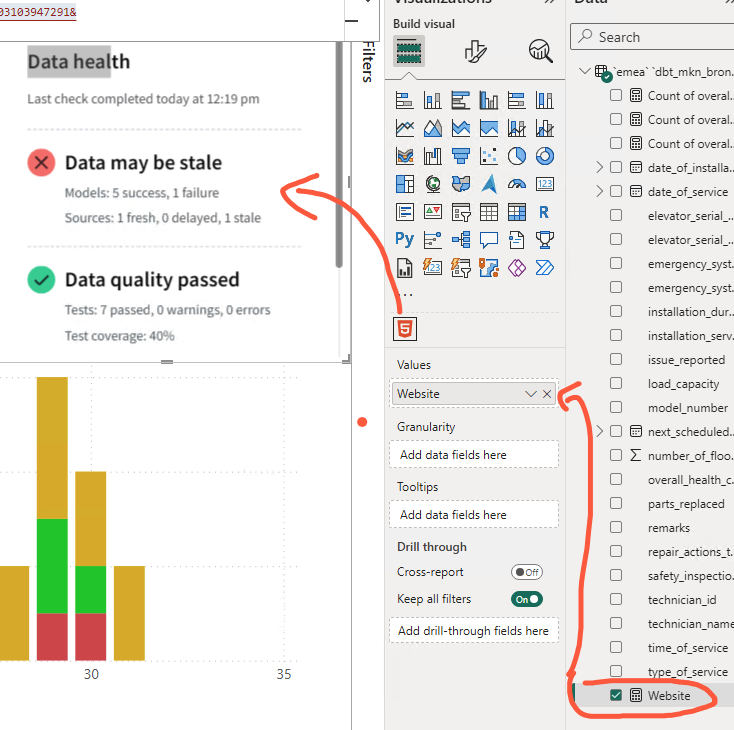](#)Drag the metric with the iFrame code into the HTML content widget in PowerBI. This should now display your data health tile.
*Refer to [this tutorial](https://www.youtube.com/watch?v=SUm9Hnq8Th8) for additional information on embedding a website into your Power BI report.*
### Tableau example
Follow these steps to embed the data health tile in Tableau:
[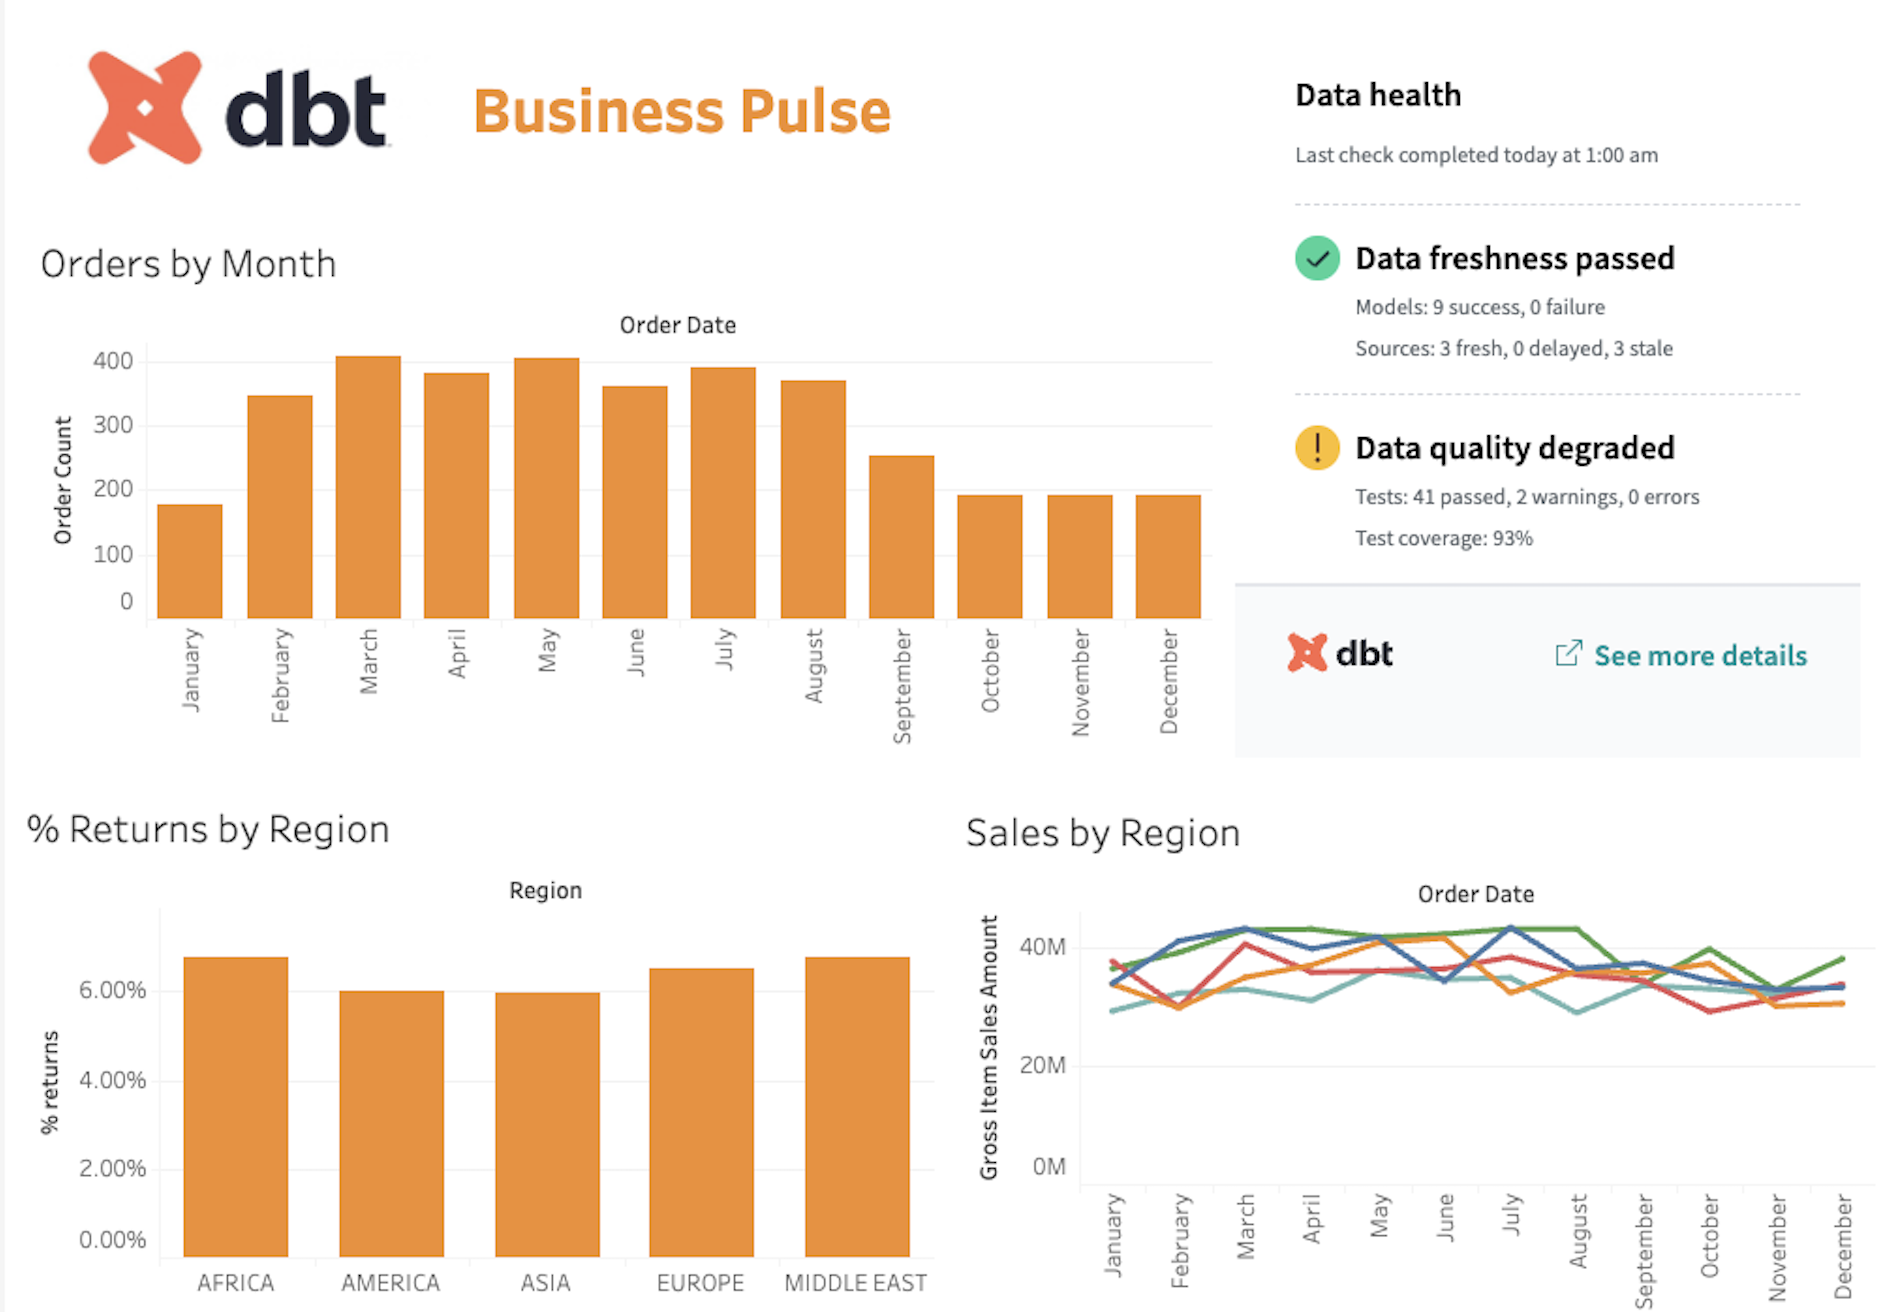](#)Embed data health tile iFrame in Tableau
1. Create a dashboard in Tableau and connect to your database to pull in the data.
2. Copy the URL or iFrame snippet available in Catalog's **Data health** section, under the **Embed data health into your dashboard** toggle.
3. Insert a **Web Page** object.
4. Paste the copied URL and click **Ok**.
The URL you copy from Catalog looks similar to the following but may include additional Tableau-specific parameters (such as `biResourceId` and `autoBiProvider=tableau`) that are required to resolve the exposure:
```text/html
https://metadata.ACCESS_URL/exposure-tile?uniqueId=exposure.EXPOSURE_NAME&environmentType=production&environmentId=220370&token=
```
5. You should now see the data health tile embedded in your Tableau dashboard.
### Sigma example
Follow these steps to embed the data health tile in Sigma:
[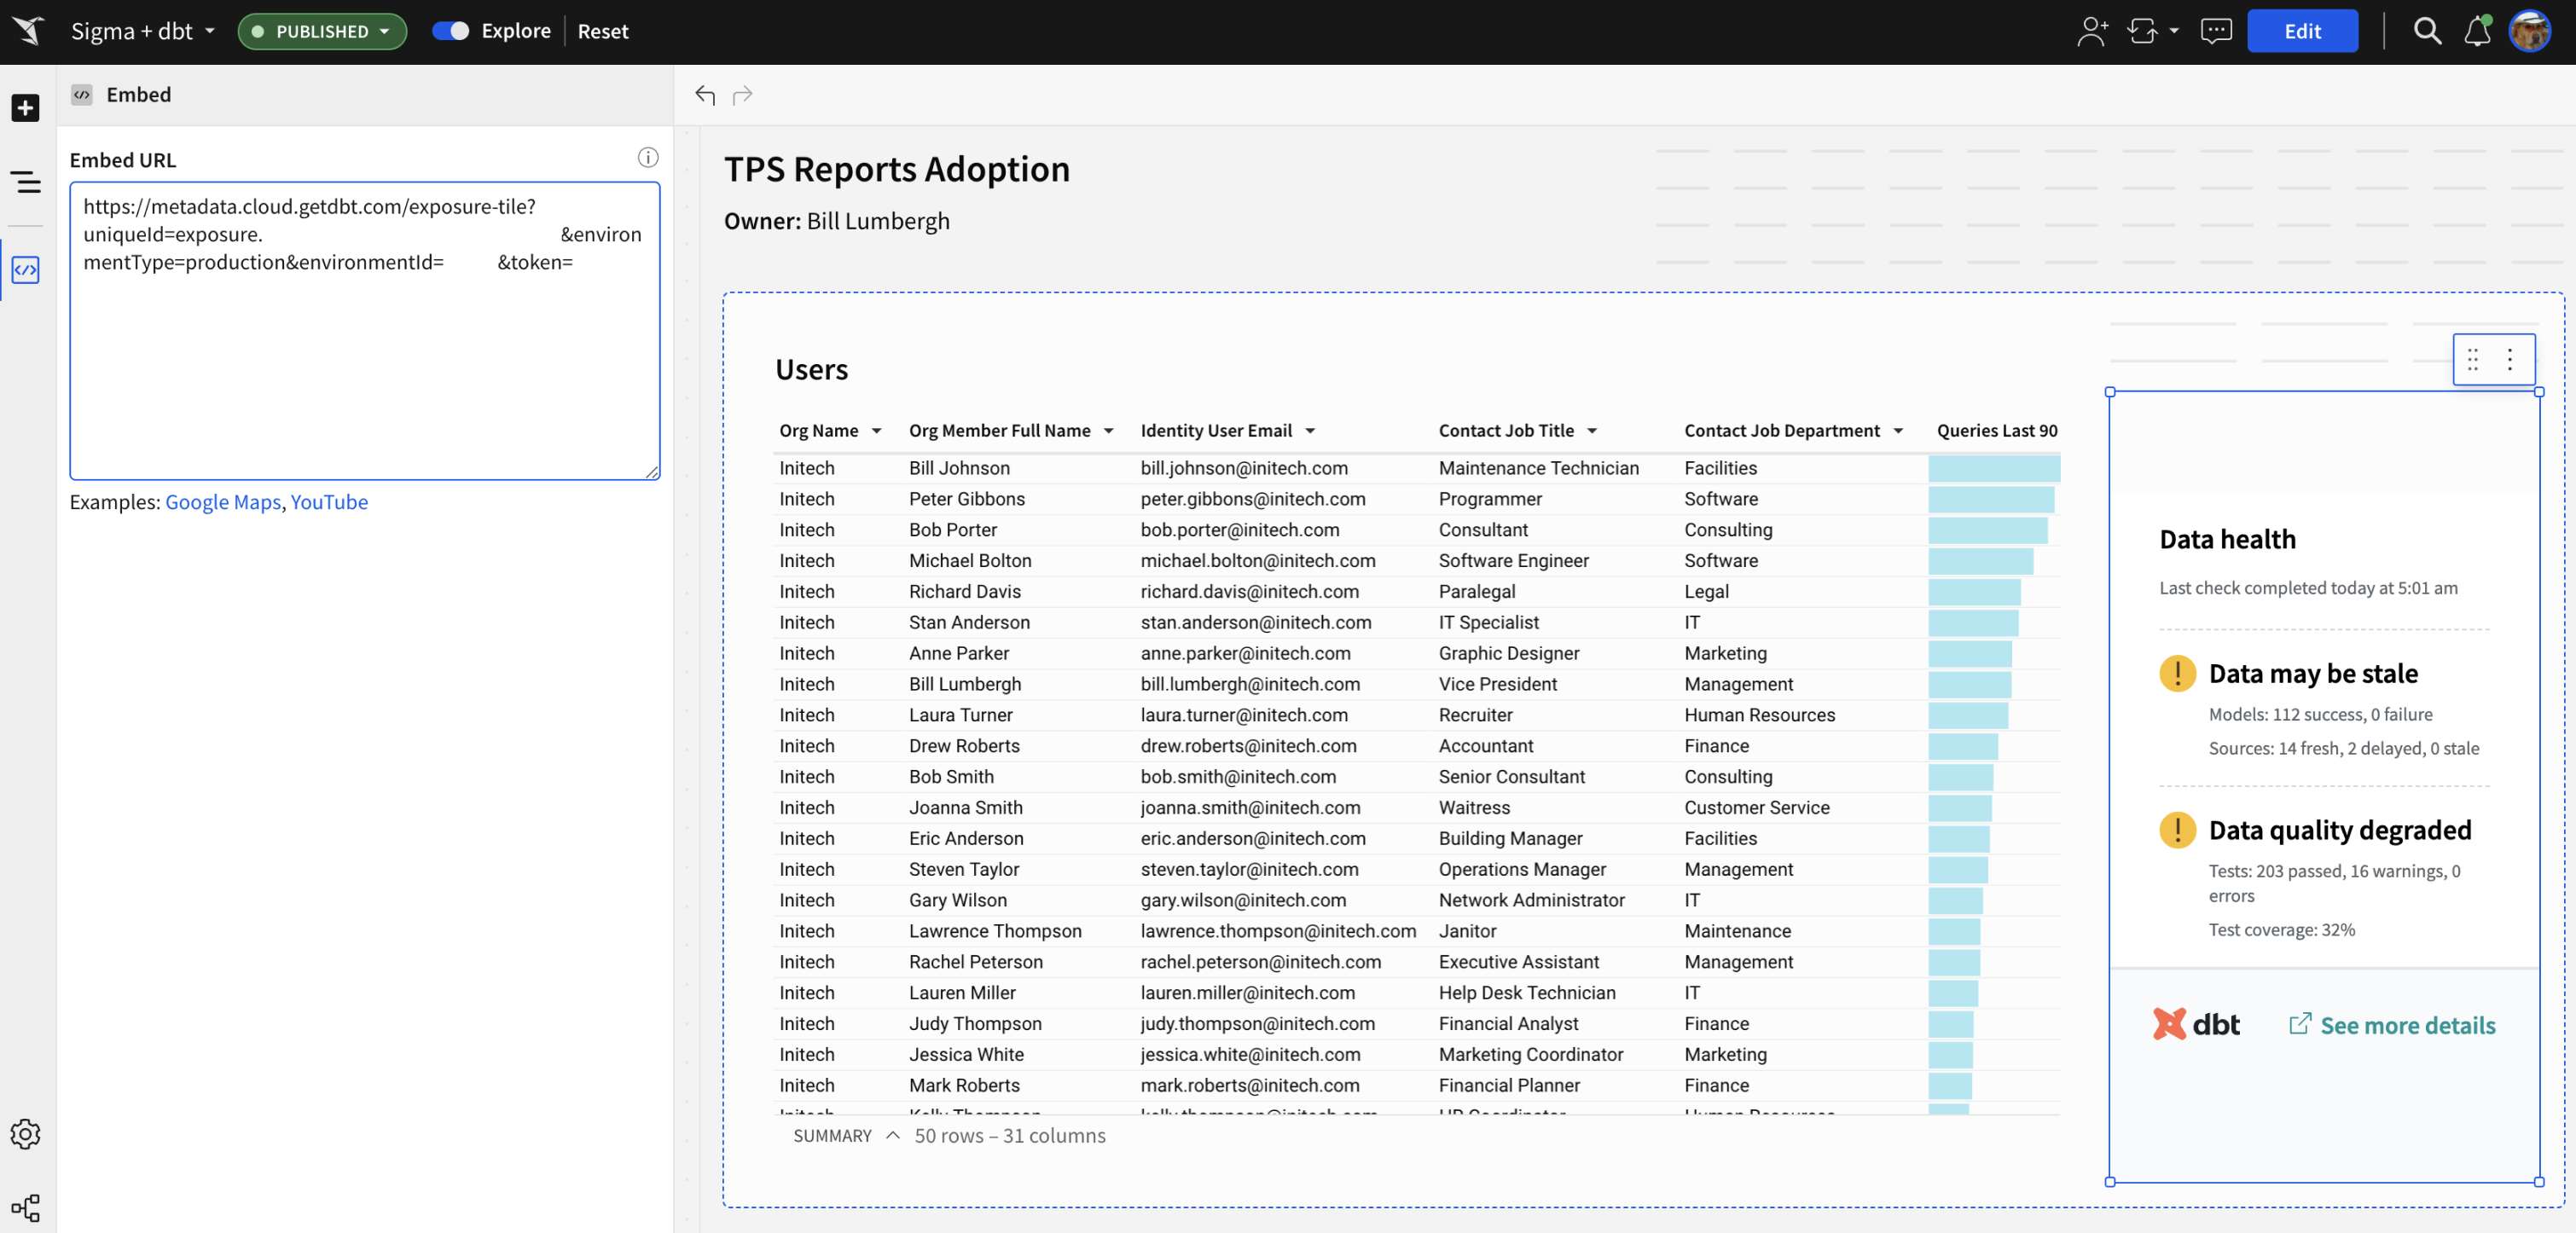](#)Embed data health tile in Sigma
1. Create a dashboard in Sigma and connect to your database to pull in the data.
2. Ensure you've copied the URL or iFrame snippet available in Catalog's **Data health** section, under the **Embed data health into your dashboard** toggle.
3. Add a new embedded UI element in your Sigma Workbook in the following format:
```html/text
https://metadata.ACCESS_URL/exposure-tile?uniqueId=exposure.EXPOSURE_NAME&environmentType=production&environmentId=ENV_ID_NUMBER&token=
```
*Note, replace the placeholders with your actual values.*
4. You should now see the data health tile embedded in your Sigma dashboard.
## Job-based data health Legacy
The default experience is the [environment-based data health tile](#view-exposure-in-dbt-explorer) with Catalog.
This section is for legacy job-based data health tiles. If you're using the revamped environment-based exposure tile, refer to the previous section. Expand the following to learn more about the legacy job-based data health tile.
Job-based data health
In dbt, the [Discovery API](../dbt-apis/discovery-api.md) can power dashboard status tiles, which are job-based. A dashboard status tile is placed on a dashboard (specifically: anywhere you can embed an iFrame) to give insight into the quality and freshness of the data feeding into that dashboard. This is done in dbt [exposures](../build/exposures.md).
#### Functionality
The dashboard status tile looks like this:
[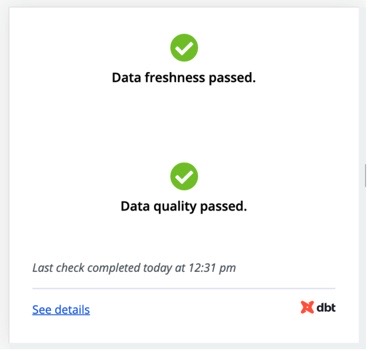](#)
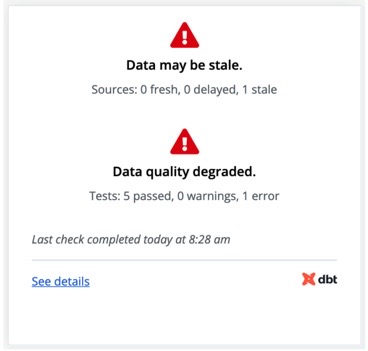
The data freshness check fails if any sources feeding into the exposure are stale. The data quality check fails if any dbt tests fail. A failure state could look like this:
[](#)
Clicking into **see details** from the Dashboard Status Tile takes you to a landing page where you can learn more about the specific sources, models, and tests feeding into this exposure.
#### Setup
First, be sure to enable [source freshness](../deploy/source-freshness.md) in the job that generates this exposure.
In order to set up your dashboard status tile, here is what you need:
1. **Metadata Only token.** You can learn how to set up a Metadata-Only token [here](../dbt-apis/service-tokens.md).
2. **Exposure name.** You can learn more about how to set up exposures [here](../build/exposures.md).
3. **Job iD.** Remember that you can select your job ID directly from the URL when looking at the relevant job in dbt.
You can insert these three fields into the following iFrame, and then embed it **anywhere that you can embed an iFrame**:
```html/text
```
Replace `YOUR_ACCESS_URL` with your region and plan's Access URL
dbt is hosted in multiple regions in the world and each region has a different access URL. Replace `YOUR_ACCESS_URL` with the appropriate [Access URL](../platform/about-platform/access-regions-ip-addresses.md) for your region and plan. For example, if your account is hosted in the EMEA region, you would use the following iFrame code:
```html/text
```
#### Embedding with BI tools
The dashboard status tile should work anywhere you can embed an iFrame. But below are some tactical tips on how to integrate with common BI tools.
### Mode
#### Mode
Mode allows you to directly [edit the HTML](https://mode.com/help/articles/report-layout-and-presentation/#html-editor) of any given report, where you can embed the iFrame.
Note that Mode has also built its own [integration](https://mode.com/get-dbt/) with the dbt Discovery API!
### Looker
#### Looker
Looker does not allow you to directly embed HTML and instead requires creating a [custom visualization](https://docs.looker.com/admin-options/platform/visualizations). One way to do this for admins is to:
* Add a [new visualization](https://fishtown.looker.com/admin/visualizations) on the visualization page for Looker admins. You can use [this URL](https://metadata.cloud.getdbt.com/static/looker-viz.js) to configure a Looker visualization powered by the iFrame. It will look like this:
[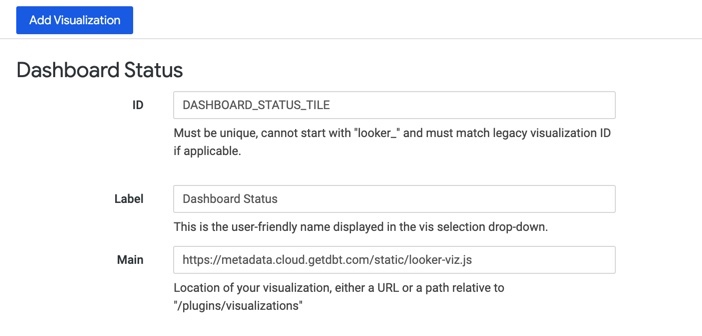](#)Configure a Looker visualization powered by the iFrame
* Once you have set up your custom visualization, you can use it on any dashboard! You can configure it with the exposure name, job ID, and token relevant to that dashboard.
[![]()](#)
### Tableau
#### Tableau
Tableau does not require you to embed an iFrame. You only need to use a Web Page object on your Tableau Dashboard and a URL in the following format:
```html/text
https://metadata.YOUR_ACCESS_URL/exposure-tile?name=&jobId=&token=
```
Replace `YOUR_ACCESS_URL` with your region and plan's Access URL
dbt is hosted in multiple regions in the world and each region has a different access URL. Replace `YOUR_ACCESS_URL` with the appropriate [Access URL](../platform/about-platform/access-regions-ip-addresses.md) for your region and plan. For example, if your account is hosted in the North American region, you would use the following code:
```html/text
https://metadata.cloud.getdbt.com/exposure-tile?name=&jobId=&token=
```
[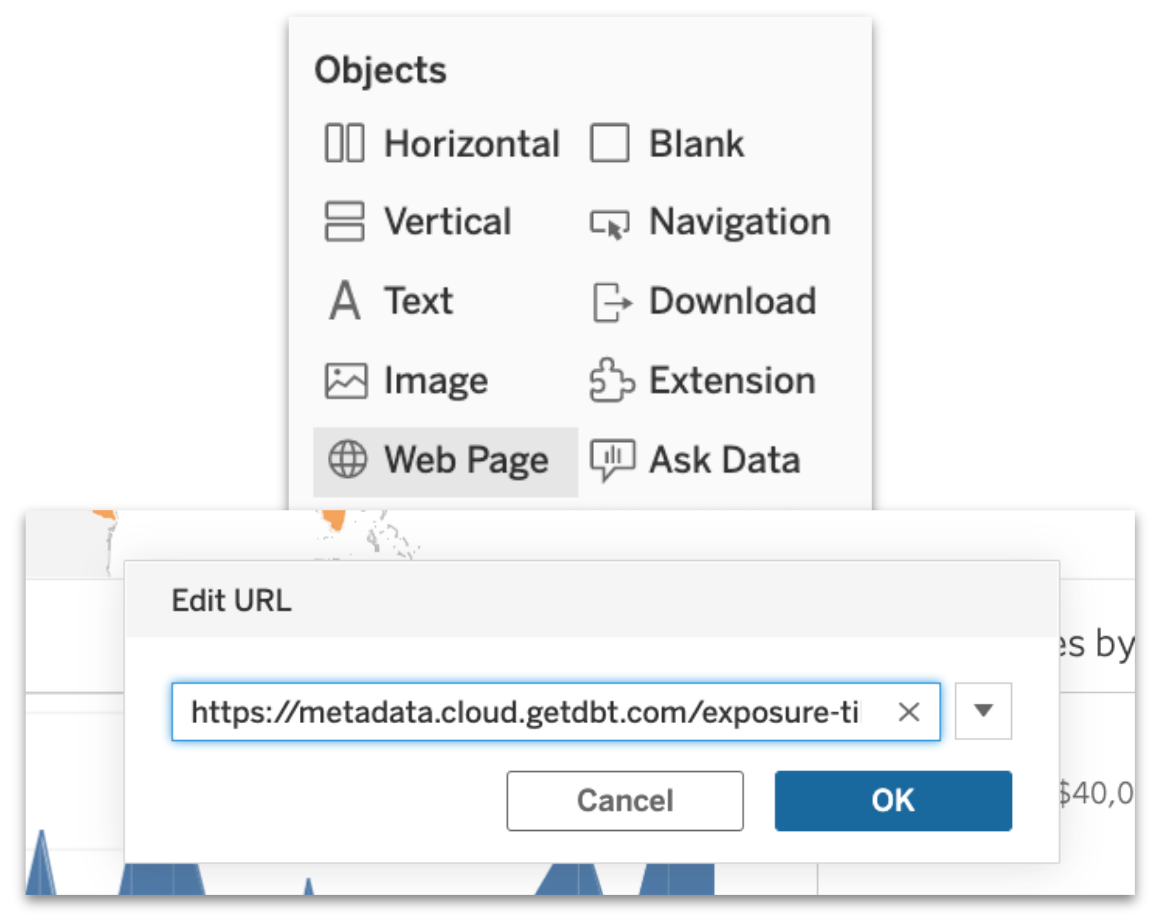](#)Configure Tableau by using a Web page object.
### Sigma
#### Sigma
Sigma does not require you to embed an iFrame. Add a new embedded UI element in your Sigma Workbook in the following format:
```html/text
https://metadata.YOUR_ACCESS_URL/exposure-tile?name=&jobId=&token=
```
Replace `YOUR_ACCESS_URL` with your region and plan's Access URL
dbt is hosted in multiple regions in the world and each region has a different access URL. Replace `YOUR_ACCESS_URL` with the appropriate [Access URL](../platform/about-platform/access-regions-ip-addresses.md) for your region and plan. For example, if your account is hosted in the APAC region, you would use the following code:
```html/text
https://metadata.au.dbt.com/exposure-tile?name=&jobId=&token=
```
[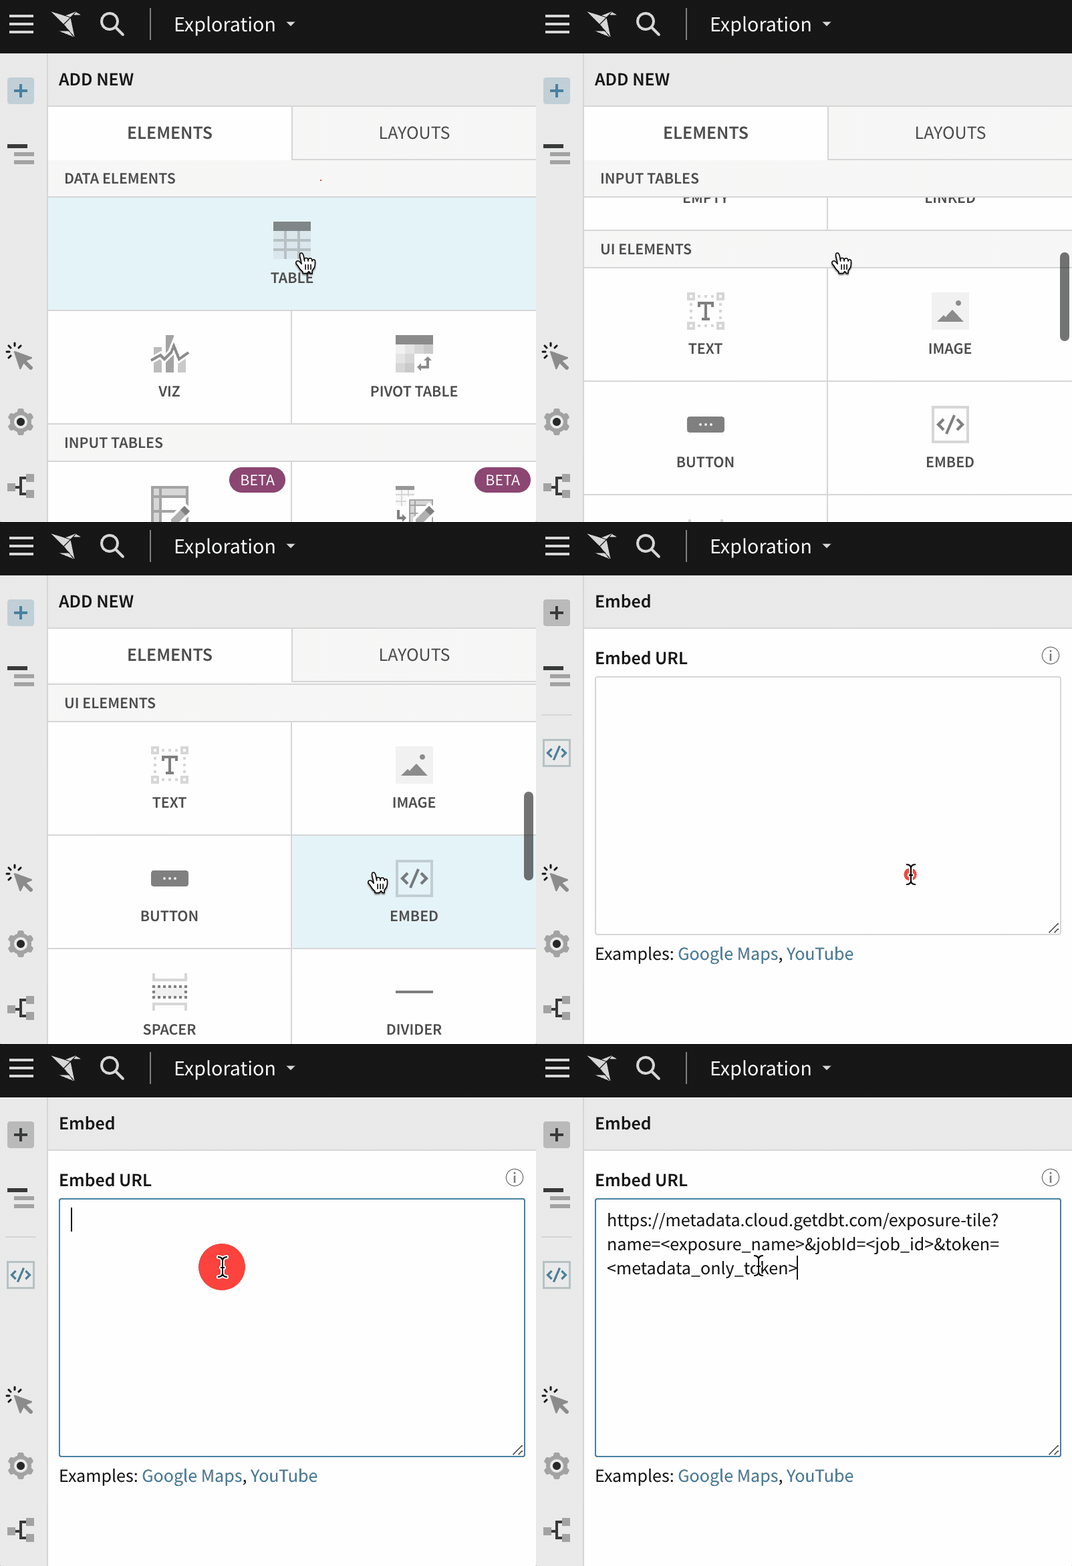](#)Configure Sigma by using an embedded UI element.
## Was this page helpful?
YesNo
[Privacy policy](https://www.getdbt.com/cloud/privacy-policy)[Create a GitHub issue](https://github.com/dbt-labs/docs.getdbt.com/issues)
This site is protected by reCAPTCHA and the Google [Privacy Policy](https://policies.google.com/privacy) and [Terms of Service](https://policies.google.com/terms) apply.