# Access the dbt Insights interface
dbt platform | Enterprise, Enterprise+
Learn how to access Insights, run queries, and view results.
Insights provides a rich console experience with editor navigation. You can expect Insights to:
* Enable you to write SQL queries, with the option to open multiple tabs
* Have SQL + dbt autocomplete suggestions and syntax highlighting
* Save SQL queries
* View the results of the query and its details using the **Data** or **Details** tabs
* Create a visualization of your query results using the **Chart** tab
* View the history of queries and their statuses (like Success, Error, Pending) using the **Query history** tab
* Use dbt Copilot in Insights to generate or edit SQL queries using natural language prompts
* Integrate with [Catalog](./explore-projects.md), [Studio IDE](../platform/studio-ide/develop-in-studio.md), and [Canvas](../platform/canvas.md) to provide a seamless experience for data exploration, AI-assisted writing, and collaboration
## Access the dbt Insights interface
Before accessing Insights, ensure that the [prerequisites](./dbt-insights.md#prerequisites) are met.
1. To access Insights, select the **Insights** option in the navigation sidebar.
2. If your [user credentials](../platform/studio-ide/develop-in-studio.md#get-started-with-the-studio-ide) aren’t set up, Insights will prompt you to set them up. The ability to query data is subject to warehouse provider permissions according to your user credentials.
3. Once your credentials are set up, you can write, run, and edit SQL queries in the Insights editor for existing models in your project.
## Run queries
To run queries in Insights, you can use:
* Standard SQL
* Jinja ([`ref`](../../reference/dbt-jinja-functions/ref.md), [`source`](../../reference/dbt-jinja-functions/source.md) functions, and other Jinja functions)
* Links from SQL code `ref` to the corresponding Explorer page
* CTEs and subqueries
* Basic aggregations and joins
* Semantic Layer queries using Semantic Layer Jinja functions
## Example
Let's use an example to illustrate how to run queries in Insights:
* A [Jaffle Shop](https://github.com/dbt-labs/jaffle-shop) location wants to count unique orders and unique customers to understand whether they can expand their awesome Jaffle shop business to other parts of the world.
* To express this logic in SQL, you (an analyst assigned to this project) want to understand yearly trends to help guide expansion decisions. Write the following SQL query to calculate the number of unique customers, cities, and total order revenue:
```sql
with
orders as (
select * from {{ ref('orders') }}
),
customers as (
select * from {{ ref('customers') }}
)
select
date_trunc('year', ordered_at) as order_year,
count(distinct orders.customer_id) as unique_customers,
count(distinct orders.location_id) as unique_cities,
to_char(sum(orders.order_total), '999,999,999.00') as total_order_revenue
from orders
join customers
on orders.customer_id = customers.customer_id
group by 1
order by 1
```
### Use dbt Copilot
To make things easier, [use dbt Copilot in Insights](./navigate-dbt-insights.md) to save time and explore other ways to analyze the data. dbt Copilot can help you quickly update the query or generate a new one based on your prompt.
info
dbt Wizard is the new and recommended AI agent for governed data development in dbt. It handles the full development lifecycle — investigation, building, validation, and shipping — grounded in your dbt project's lineage, tests, contracts, and metric definitions.
dbt Copilot is separate from dbt Wizard and is dbt's inline AI assistance experience, providing single-click generation of SQL, documentation, tests, and semantic models in Studio IDE, Canvas, and Insights.
Refer to [dbt AI FAQs](../dbt-ai/dbt-ai-faqs.md#is-dbt-wizard-the-same-as-dbt-copilot), [Billing](../platform/billing.md), and [dbt's Terms of Use](https://www.getdbt.com/terms-of-use) for more information.
1. Click the **dbt Copilot** icon in the Query console sidebar.
2. In the dropdown menu above the dbt Copilot prompt box, select **Generate SQL**.
3. Enter your prompt in natural language and ask for a yearly breakdown of unique customers and total revenue.
4. Click **↑** to submit your prompt.
5. dbt Copilot responds with:
* A summary of the query
* An explanation of the logic
* The SQL it generated
* Options to **Add** or **Replace** the existing query with the generated SQL
6. Review the output and click **Replace** to use the dbt Copilot-generated SQL in your editor.
7. Click **Run** to preview the results.
[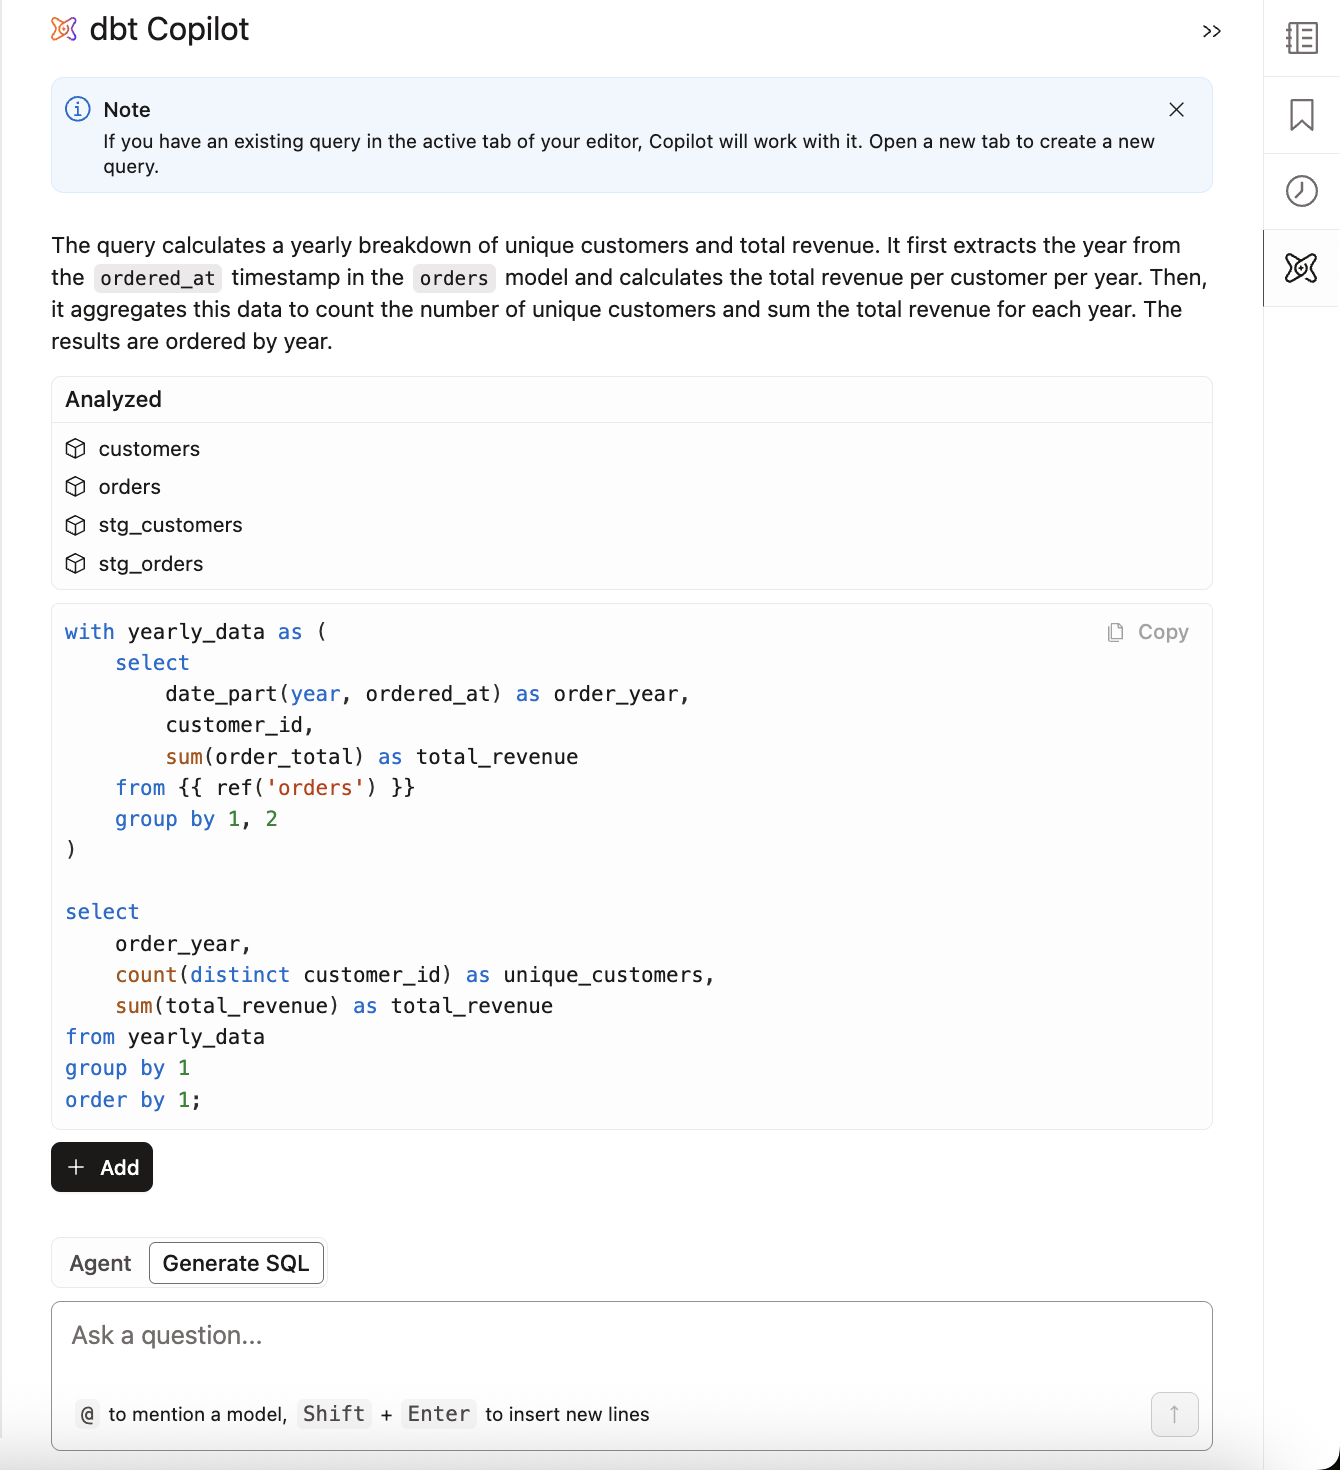](#)dbt Insights with dbt Copilot
From here, you can:
* Continue building or modifying the query using dbt Copilot.
* Explore the [results](#view-results) in the **Data** tab.
* [View metadata and query details](#view-details) in the **Details** tab.
* [Visualize results](#chart-results) in the **Chart** tab.
* Check the [**Query history**](#query-history) for status and past runs.
* Use [**Catalog**](#use-dbt-explorer) to explore model lineage and context.
* If you want to save the query, you can click **Save Insight** in the [query console menu](./navigate-dbt-insights.md#query-console-menu) to save it for future reference.
Want to turn a query into a model?
You can access the [Studio IDE](../platform/studio-ide/develop-in-studio.md) or [Canvas](../platform/canvas.md) from the [Query console menu](./navigate-dbt-insights.md#query-console-menu) to promote your SQL into a reusable dbt model — all within dbt!
### View results
Using the same example, you can perform some exploratory data analysis by running the query and:
* Viewing results in **Data** tab — View the paginated results of the query.
* Sorting results — Click on the column header to sort the results by that column.
* Exporting to CSV — On the top right of the table, click the download button to export the dataset.
[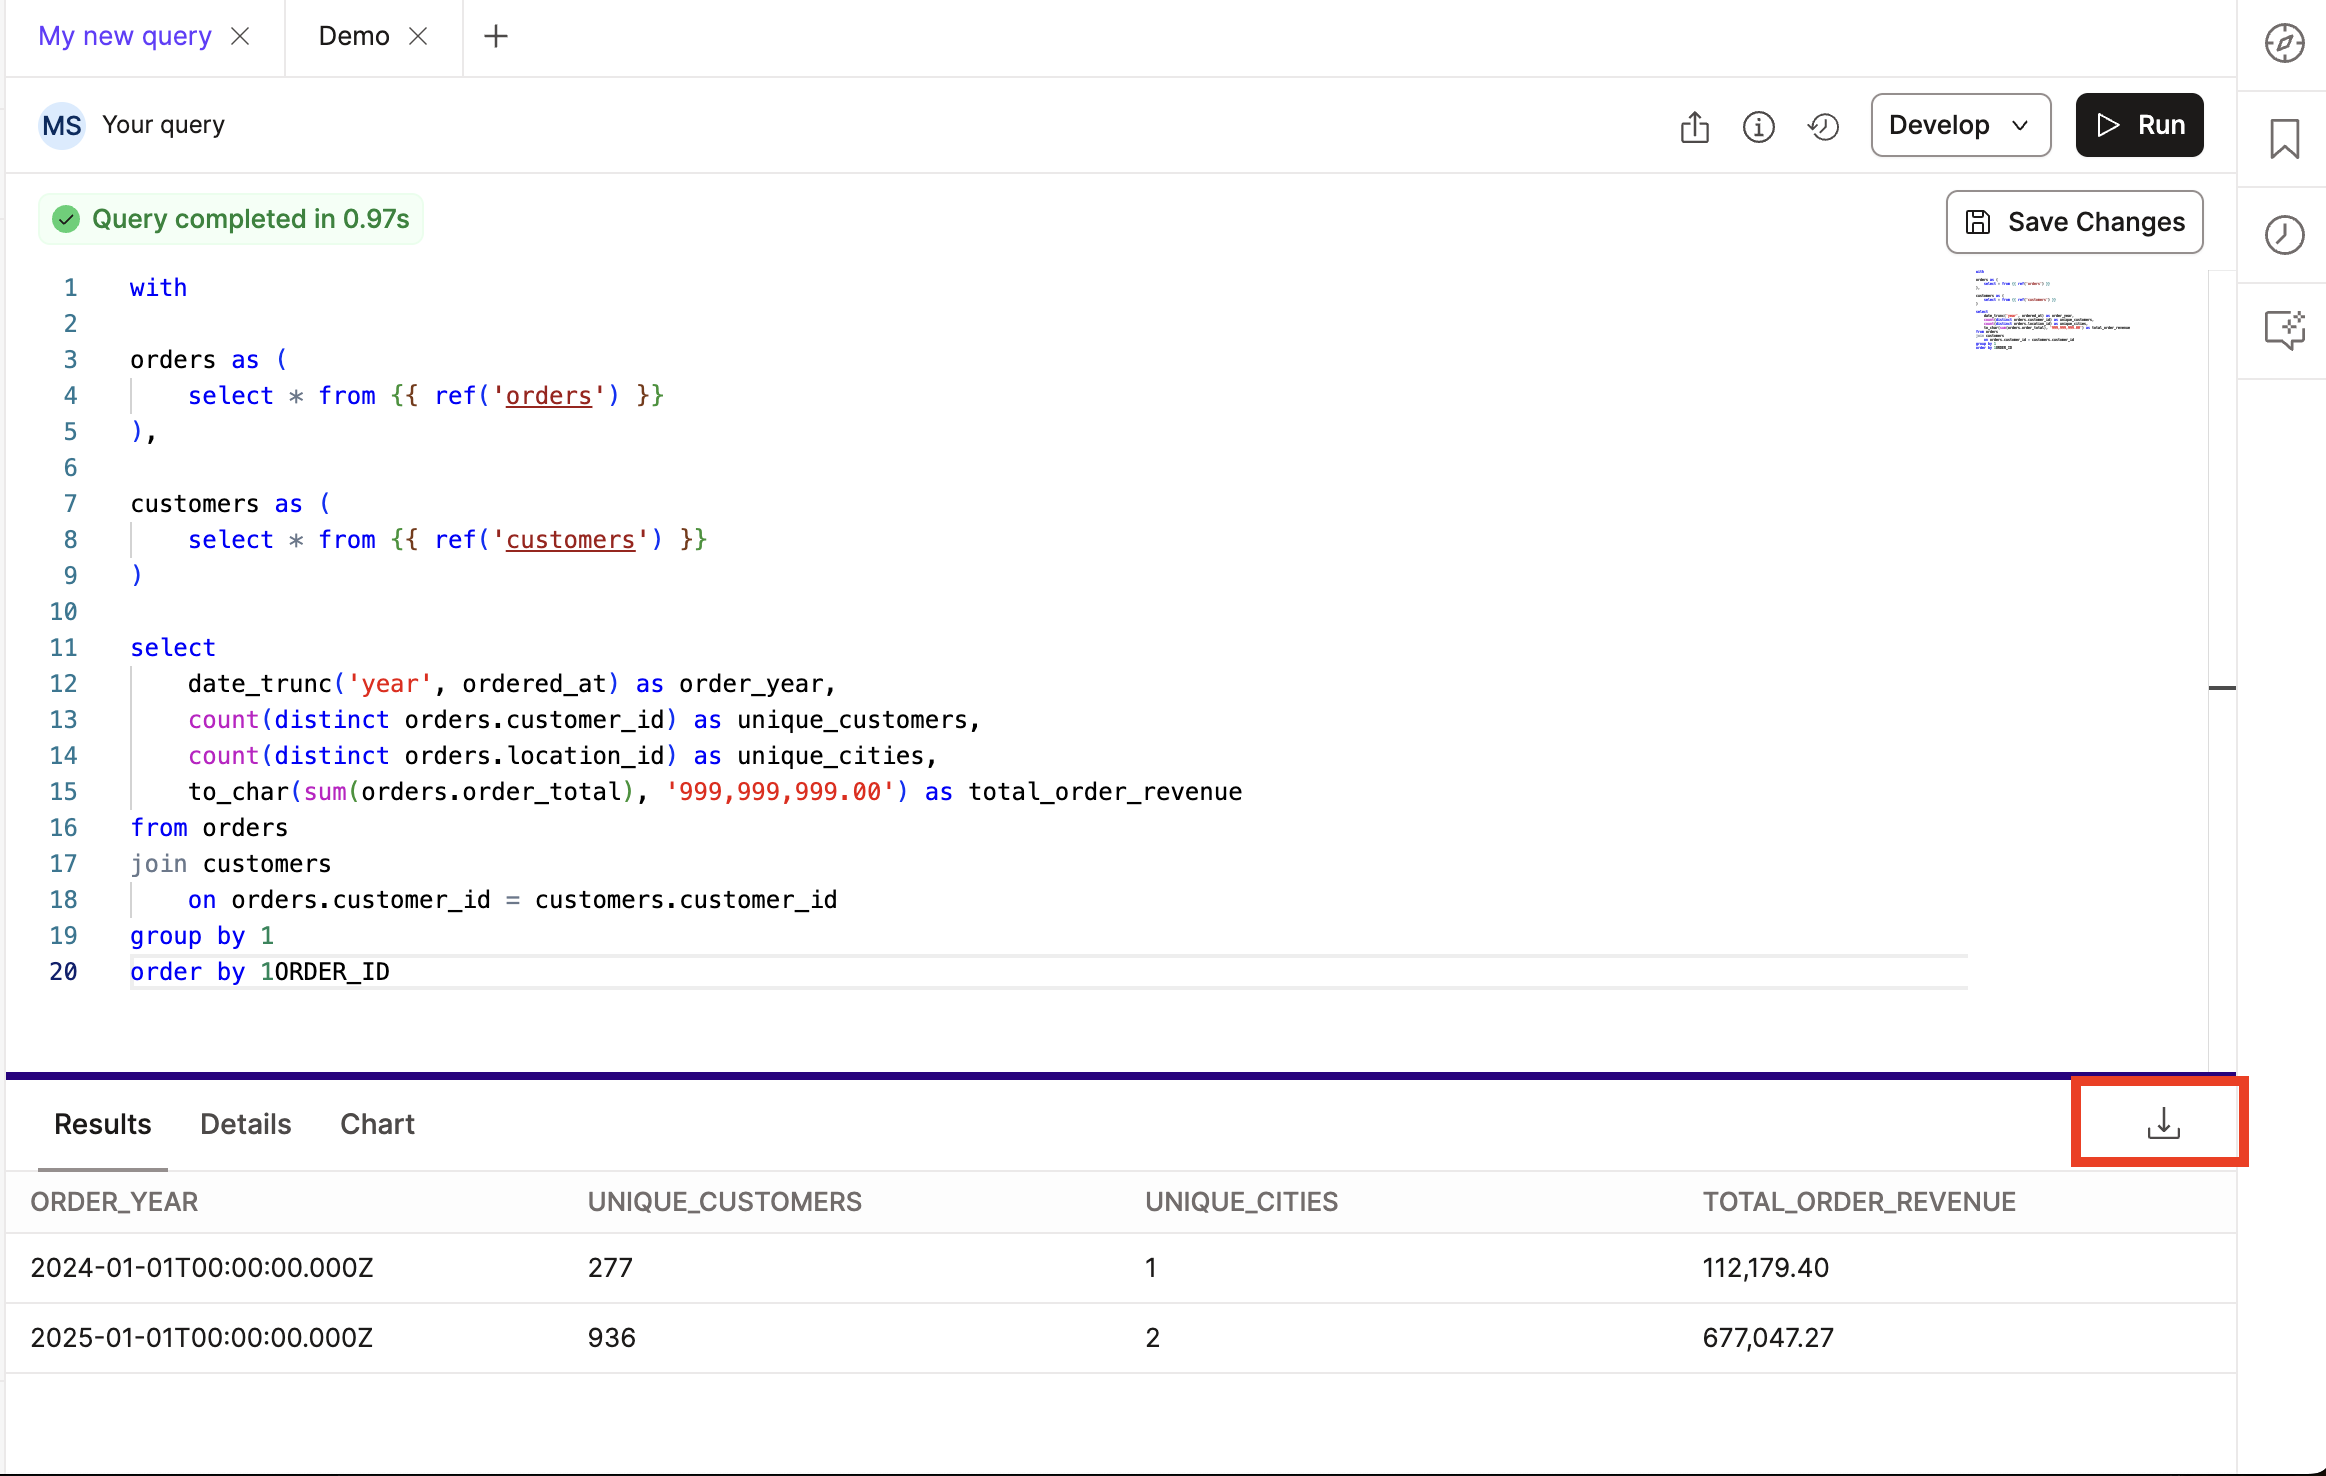](#)dbt Insights Export to CSV
### View details
View the details of the query by clicking on the **Details** tab:
* **Query metadata** — dbt Copilot-generated title and description, the supplied SQL, and corresponding compiled SQL.
* **Connection details** — Relevant data platform connection information.
* **Query details** — Query duration, status, column count, row count.
[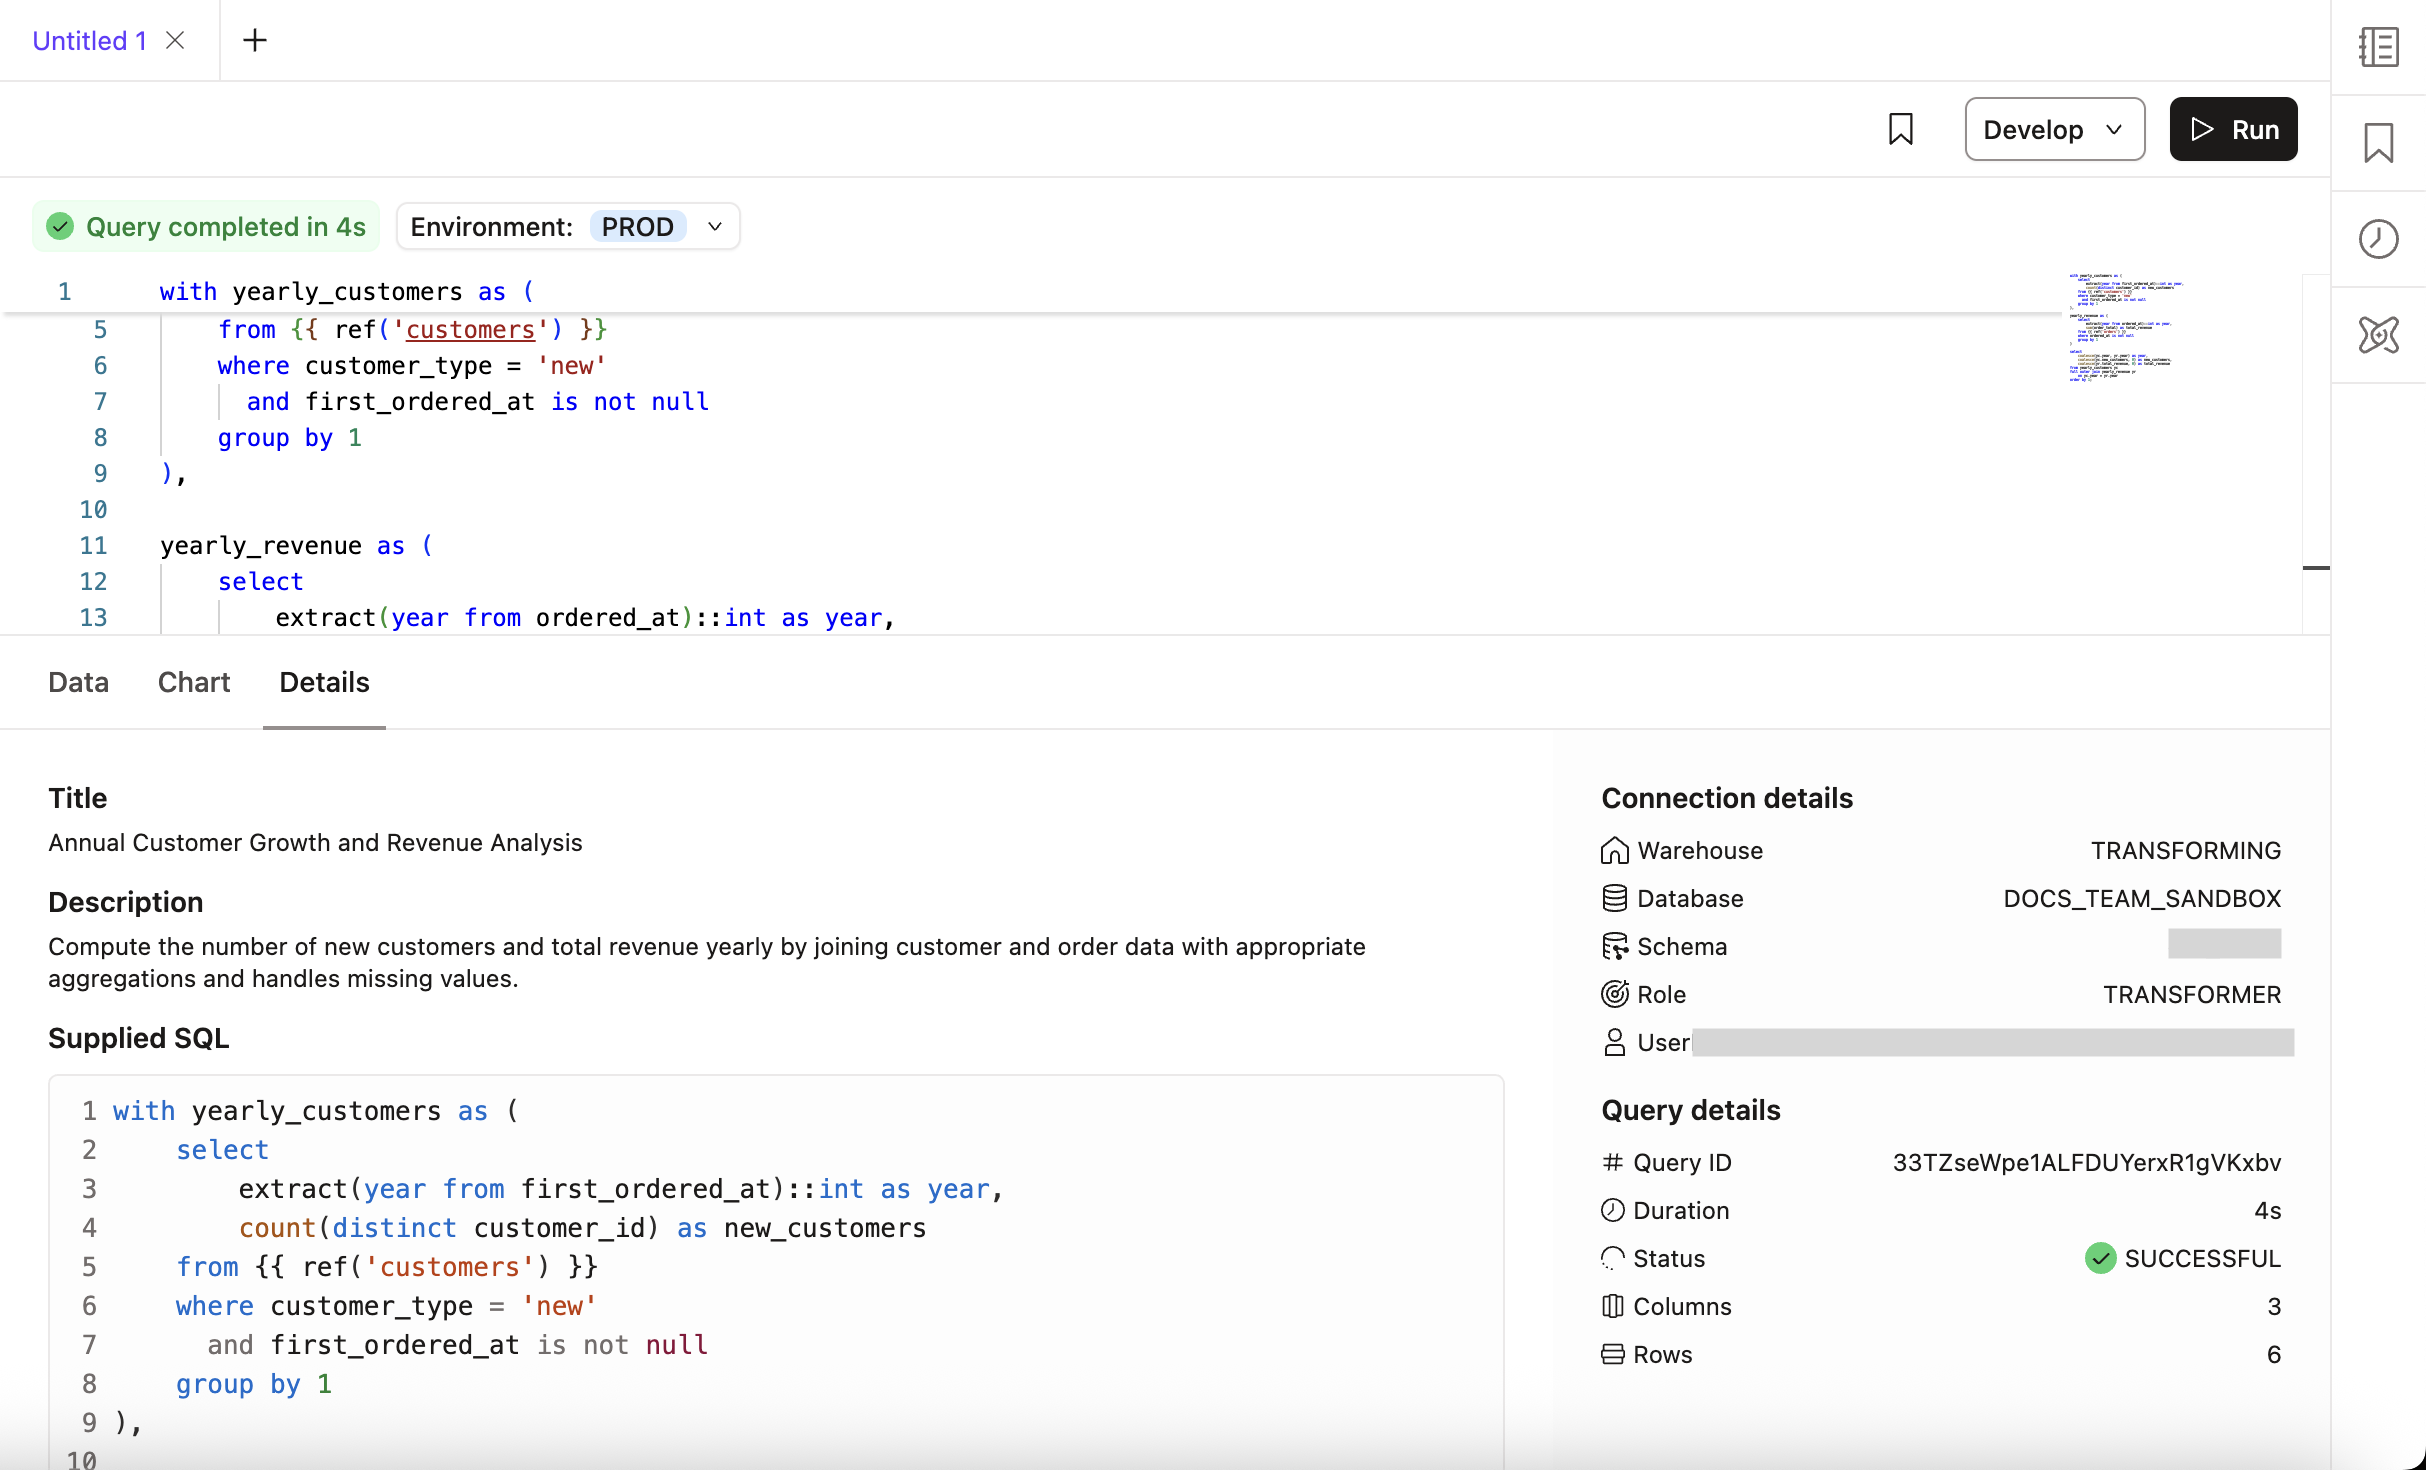](#)dbt Insights Details tab
### Chart results
Visualize the chart results of the query by clicking on the **Chart** tab to:
* Select the chart type using the chart icon.
* Choose from **line chart, bar chart, or scatterplot**.
* Select the axis and columns to visualize using the **Chart settings** icon.
[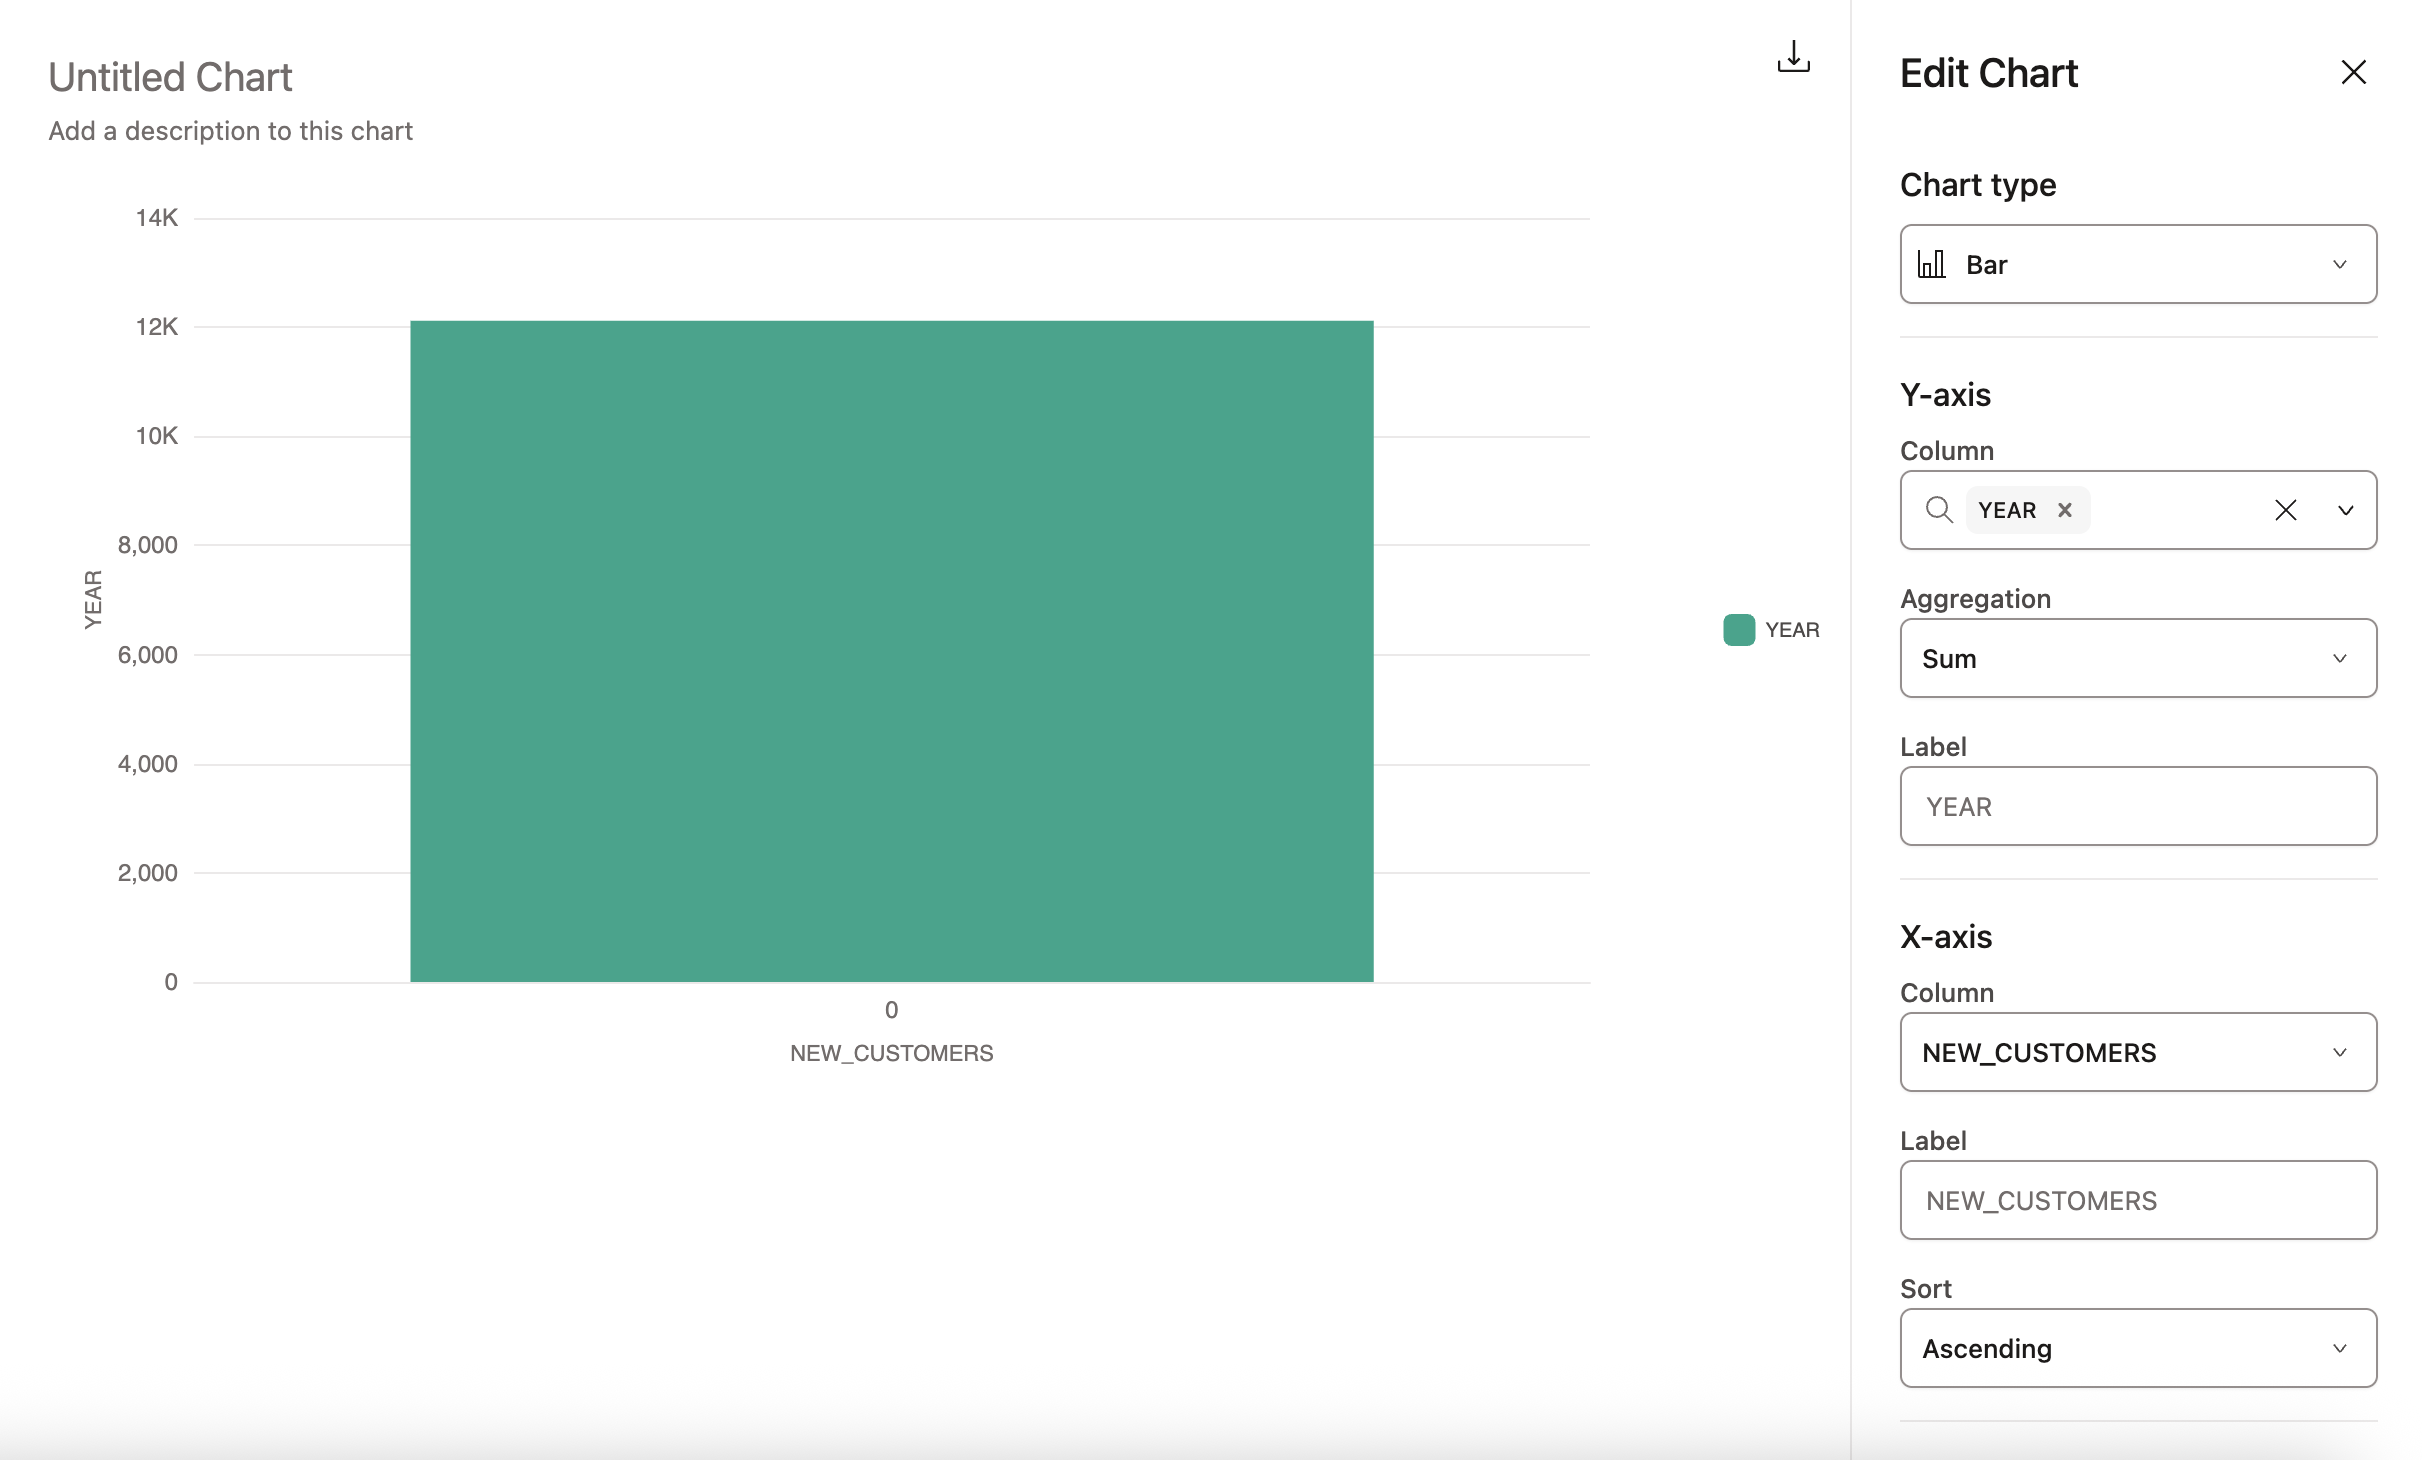](#)dbt Insights Chart tab
### Query history
View the history of queries and their statuses (All, Success, Error, or Pending) using the **Query history** icon:
* Select a query to re-run to view the results.
* Search for past queries and filter by status.
* Hover over the query to view the SQL code or copy it.
The query history is stored indefinitely.
[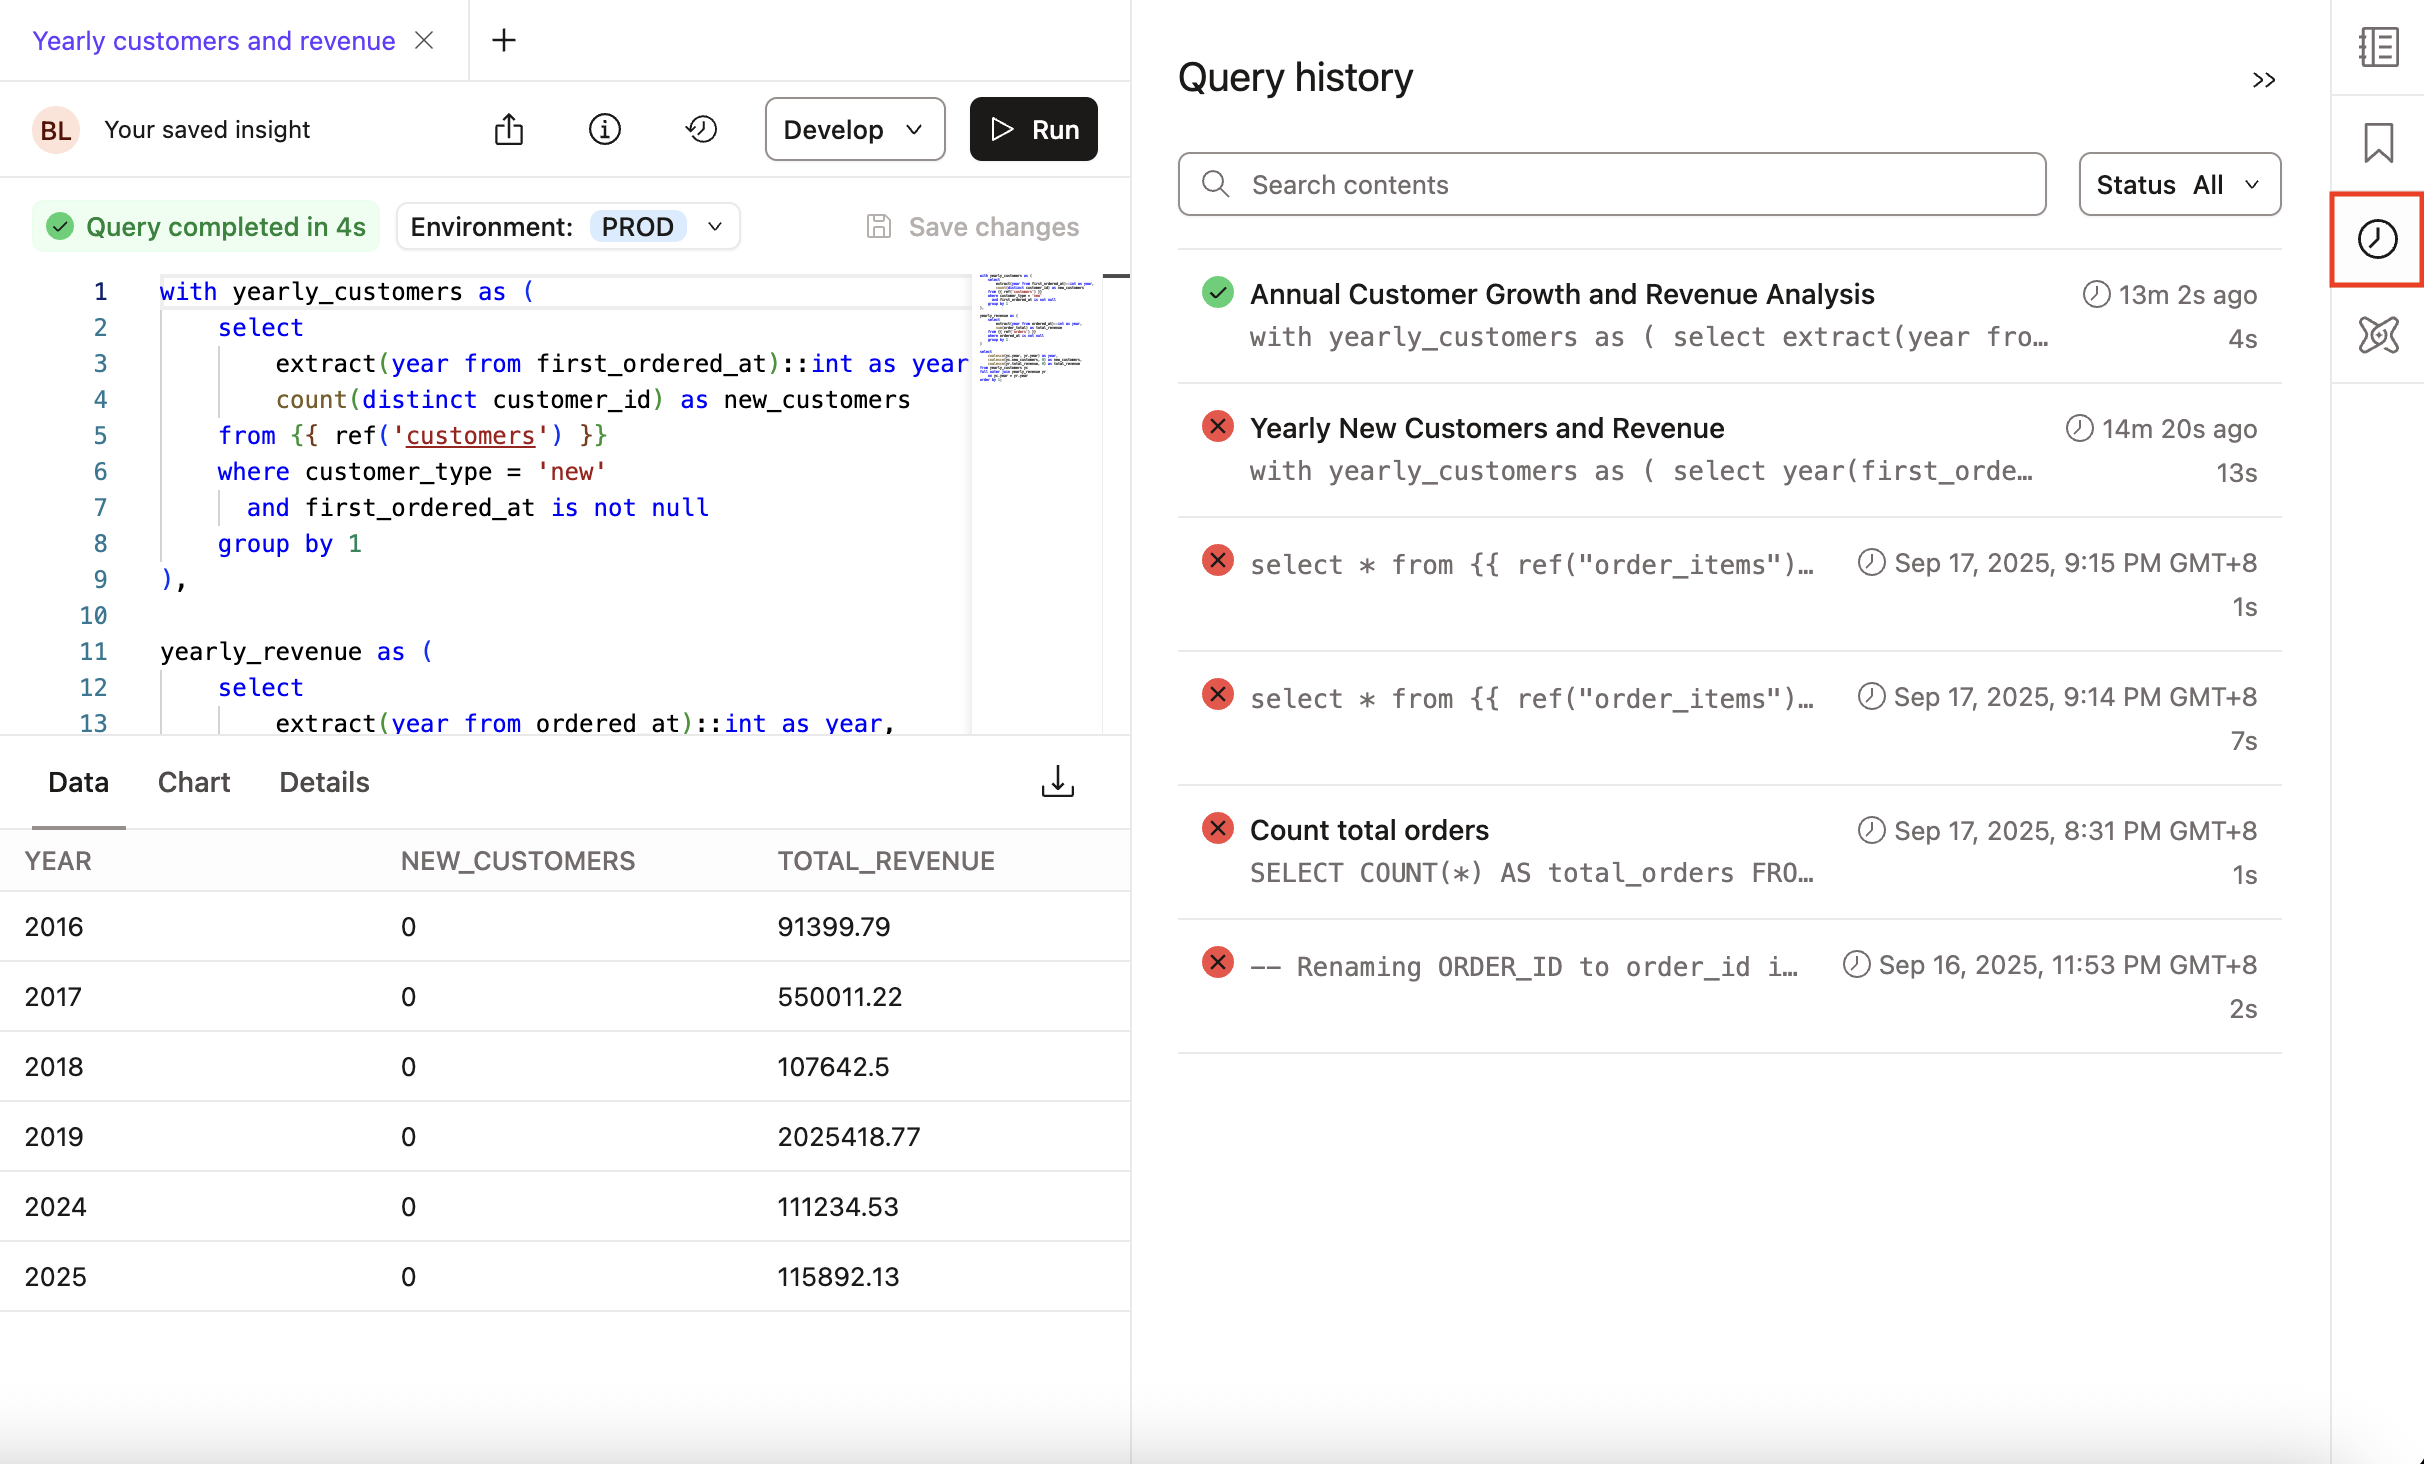](#)dbt Insights Query history icon
### Use dbt Catalog
Access [Catalog](./explore-projects.md) directly in Insights to view project resources such as models, columns, metrics, and dimensions, and more — all integrated in the Insights interface.
This integrated view allows you and your users to maintain your query workflow, while getting more context on models, semantic models, metrics, macros, and more. The integrated Catalog view comes with:
* Same search capabilities as Catalog
* Allows users to narrow down displayed objects by type
* Hyperlink from SQL code `ref` to the corresponding Catalog page
* View assets in more detail by opening with the full Catalog experience or open them in dbt Copilot.
To access Catalog, click on the **Catalog** icon in the [Query console sidebar menu](./navigate-dbt-insights.md#query-console-sidebar-menu).
[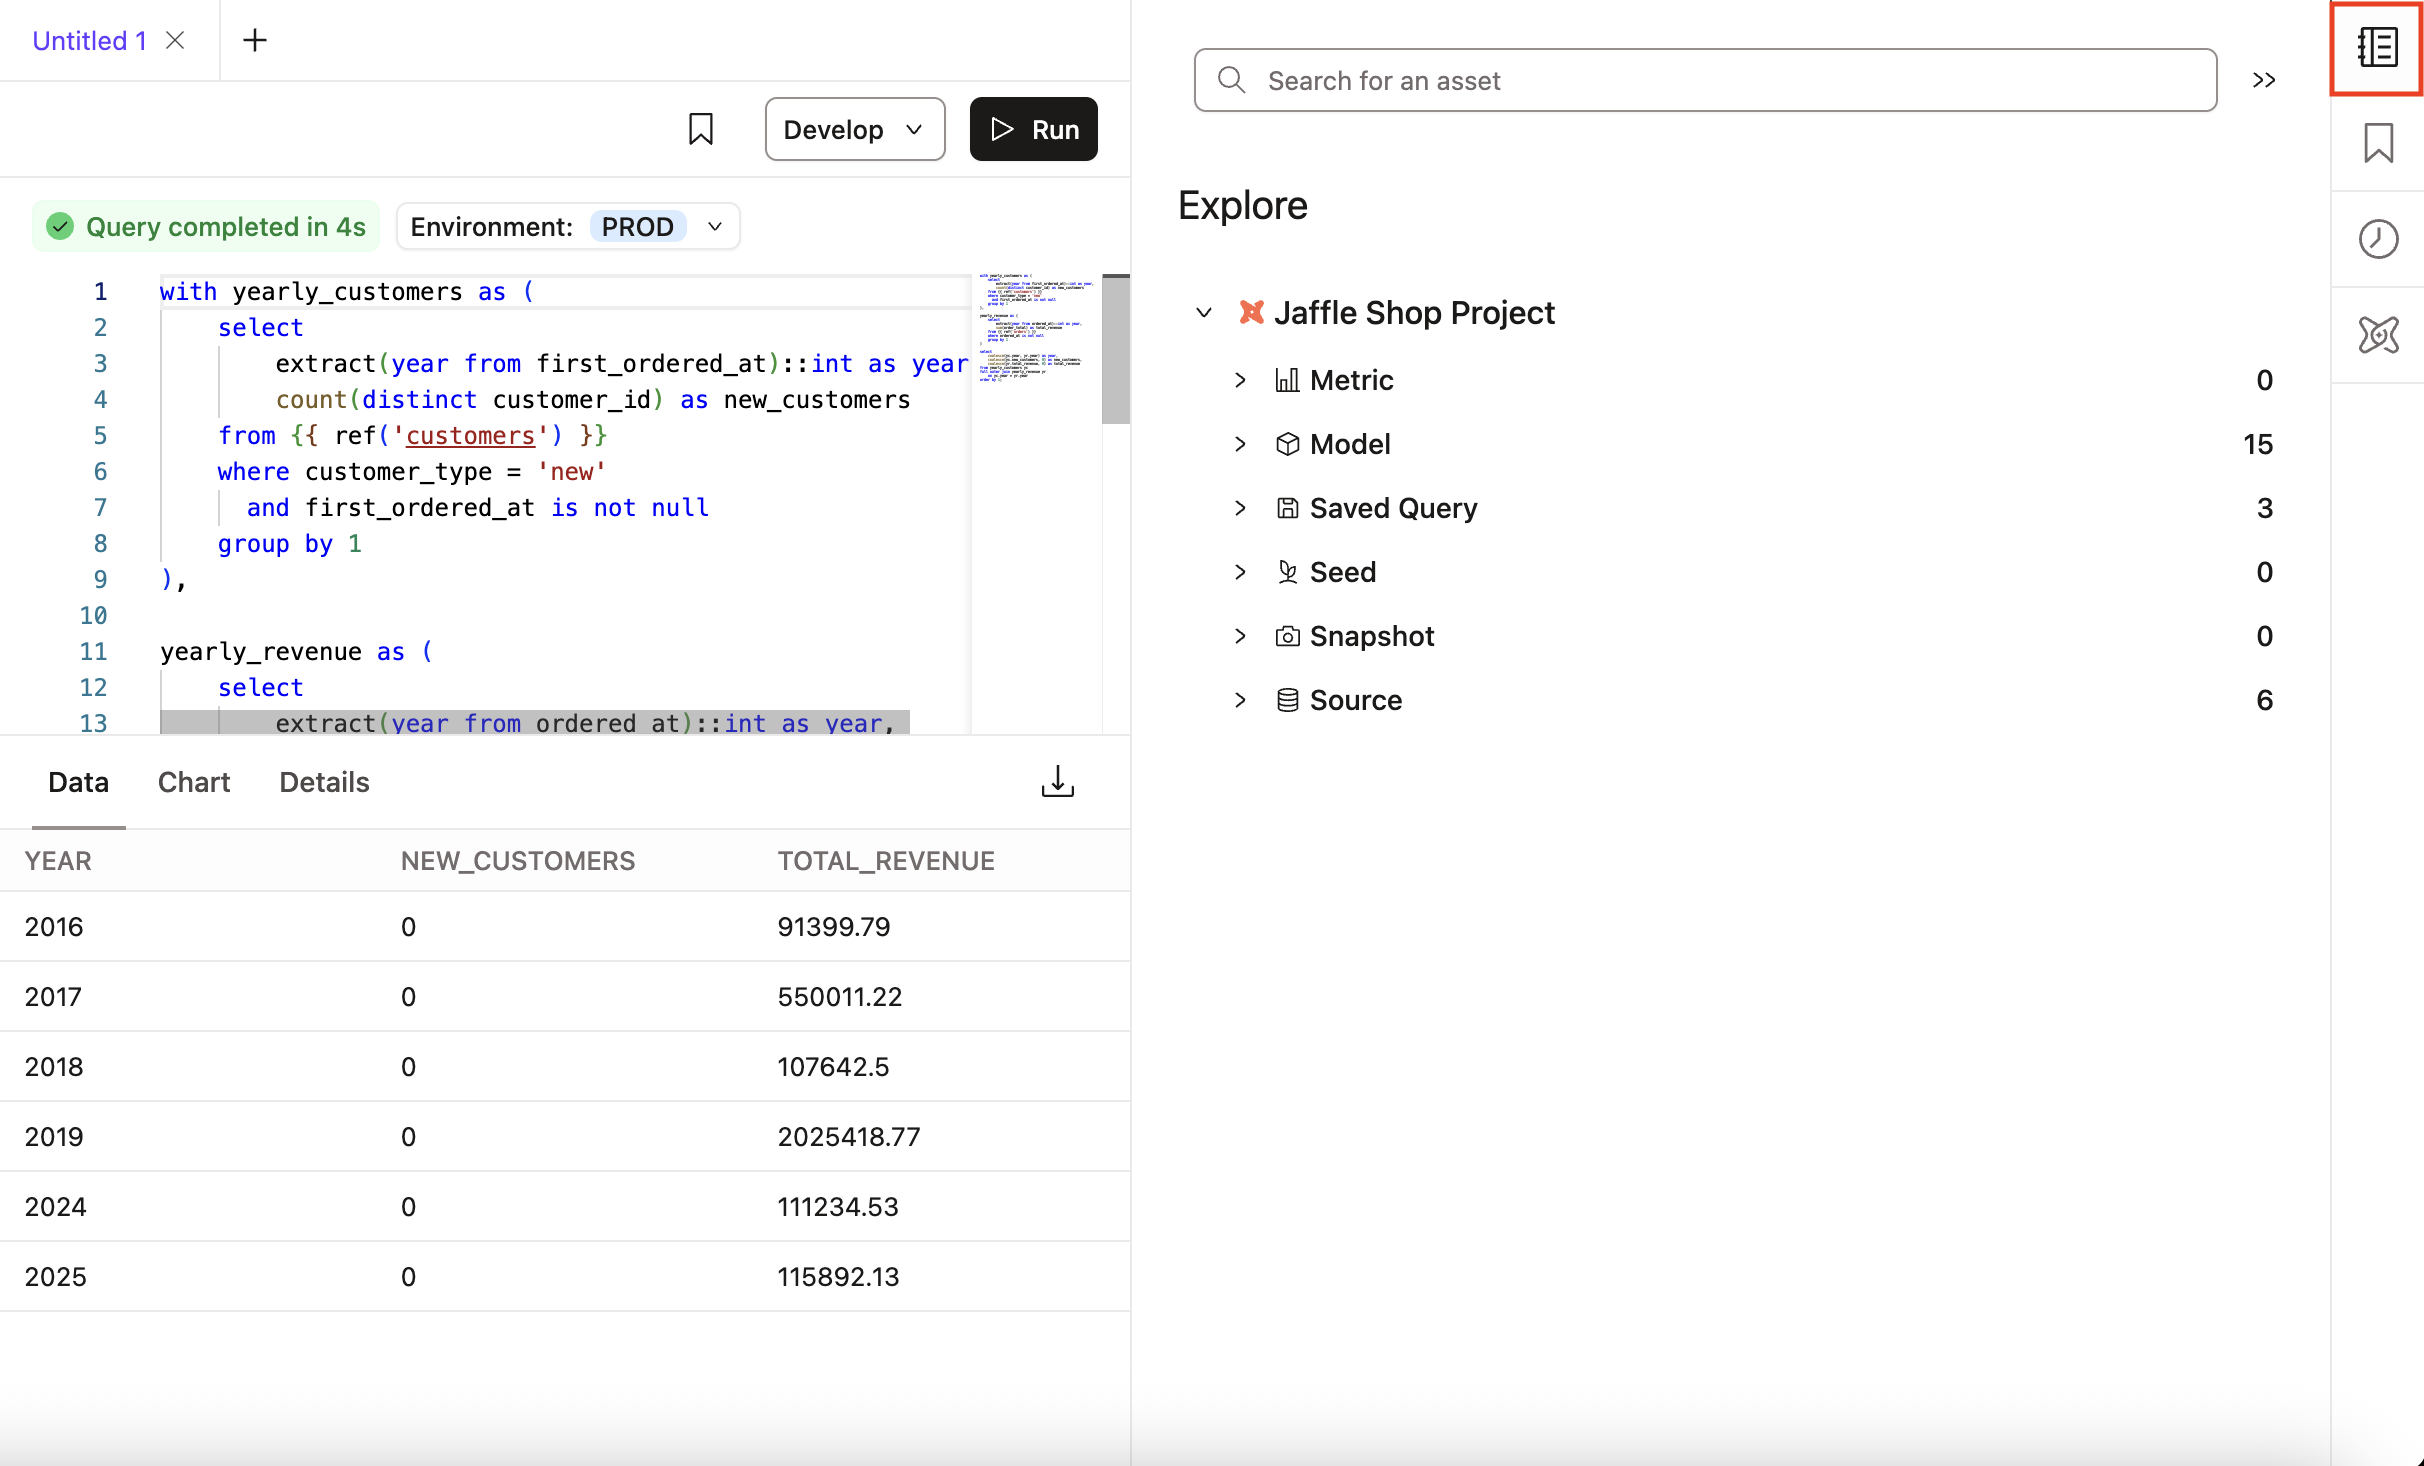](#)dbt Insights integrated with dbt Catalog
### Set Jinja environment
Set the compilation environment to control how Jinja functions are rendered. This feature:
* Supports "typed" environments marked as `Production`, `Staging`, and/or `Development`.
* Enables you to run Semantic Layer. queries against staging environments (development environments not supported).
* Still uses the individual user credentials, so users must have appropriate access to query `PROD` and `STG`.
* Changing the environment changes context for the Catalog view in Insights, as well as the environment context during the handoff to Catalog and Canvas. For example, switching to `Staging` in Insights and selecting **View in Catalog** will open the `Staging` view in Catalog.
[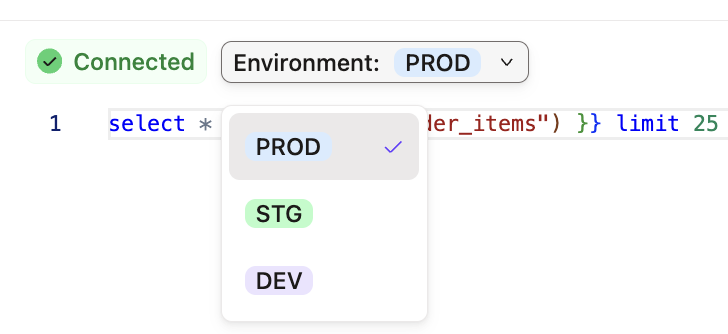](#)Set the environment for your Jinja context
## Save your Insights
Insights offers a robust save feature for quickly finding the queries you use most. There's also an option to share saved Insights with other dbt users (and have them share with you). Click the **bookmark icon** in a query to add it to your list!
* Click the **bookmark icon** on the right menu to manage your saved Insights. You can view your personal and shared queries
[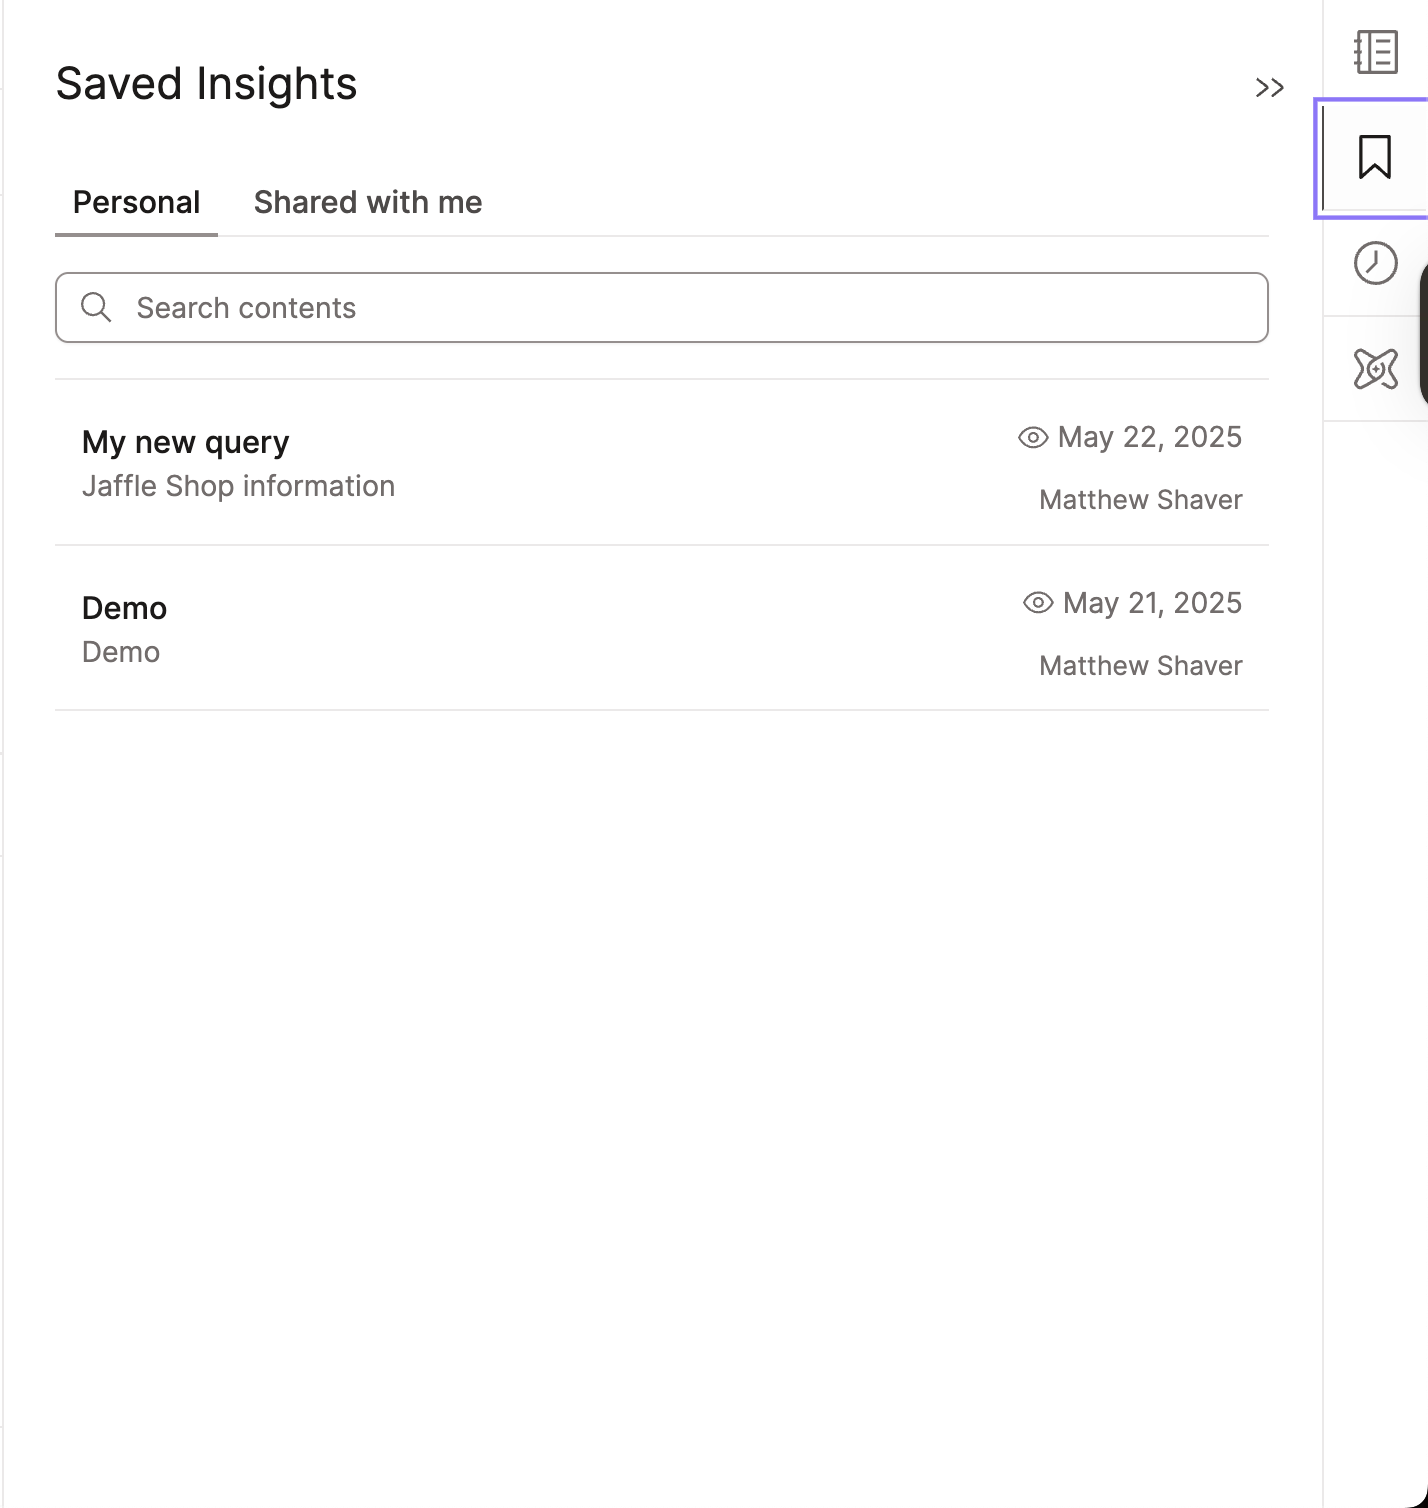](#)Manage your saved Insights
* View saved Insight details including description and creation date in the **Overview** tab.
* View the Insight history in the **Version history** tab. Click a version to compare it the current and view changes.
## Considerations
* Insights uses your user credentials to query. You have the ability to query against any object in your data warehouse that is accessible using your user credentials configured in **Account settings**.
* Every Jinja function uses [`defer --favor-state`](../../reference/node-selection/defer.md) to resolve Jinja.
## FAQs
* What’s the difference between Insights and Catalog?
* That’s a great question! Catalog helps you understand your dbt project's structure, resources, lineage, and metrics, offering context for your data.
* Insights builds on that context, allowing you to write, run, and iterate on SQL queries directly in dbt. It’s designed for ad-hoc or exploratory analysis and empowers business users and analysts to explore data, ask questions, and collaborate seamlessly.
* Catalog provides the context, while Insights enables action.
## Was this page helpful?
YesNo
[Privacy policy](https://www.getdbt.com/cloud/privacy-policy)[Create a GitHub issue](https://github.com/dbt-labs/docs.getdbt.com/issues)
This site is protected by reCAPTCHA and the Google [Privacy Policy](https://policies.google.com/privacy) and [Terms of Service](https://policies.google.com/terms) apply.