Use cases and examples for the Discovery API
With the Discovery API, you can query the metadata in dbt to learn more about your dbt deployments and the data it generates to analyze them and make improvements.
You can use the API in a variety of ways to get answers to your business questions. Below describes some of the uses of the API and is meant to give you an idea of the questions this API can help you answer.
| Loading table... |
Performance
You can use the Discovery API to identify inefficiencies in pipeline execution to reduce infrastructure costs and improve timeliness. Below are example questions and queries you can run.
For performance use cases, people typically query the historical or latest applied state across any part of the DAG (for example, models) using the environment, modelHistoricalRuns, or job-level endpoints.
How long did each model take to run?
It’s helpful to understand how long it takes to build models (tables) and tests to execute during a dbt run. Longer model build times result in higher infrastructure costs and fresh data arriving later to stakeholders. Analyses like these can be in observability tools or ad-hoc queries, like in a notebook.
Example query with code
Data teams can monitor the performance of their models, identify bottlenecks, and optimize the overall data pipeline by fetching execution details like executionTime and runElapsedTime:
- Use latest state environment-level API to get a list of all executed models and their execution time. Then, sort the models by
executionTimein descending order.
query AppliedModels($environmentId: BigInt!, $first: Int!) {
  environment(id: $environmentId) {
    applied {
      models(first: $first) {
        edges {
          node {
            name
            uniqueId
            materializedType
            executionInfo {
              lastSuccessRunId
              executionTime
              executeStartedAt
            }
          }
        }
      }
    }
  }
}
- Get the most recent 20 run results for the longest running model. Review the results of the model across runs or you can go to the job/run or commit itself to investigate further.
query ModelHistoricalRuns(
  $environmentId: BigInt!
  $uniqueId: String
  $lastRunCount: Int
) {
  environment(id: $environmentId) {
    applied {
      modelHistoricalRuns(
        uniqueId: $uniqueId
        lastRunCount: $lastRunCount
      ) {
        name
        runId
        runElapsedTime
        runGeneratedAt
        executionTime
        executeStartedAt
        executeCompletedAt
        status
      }
    }
  }
}
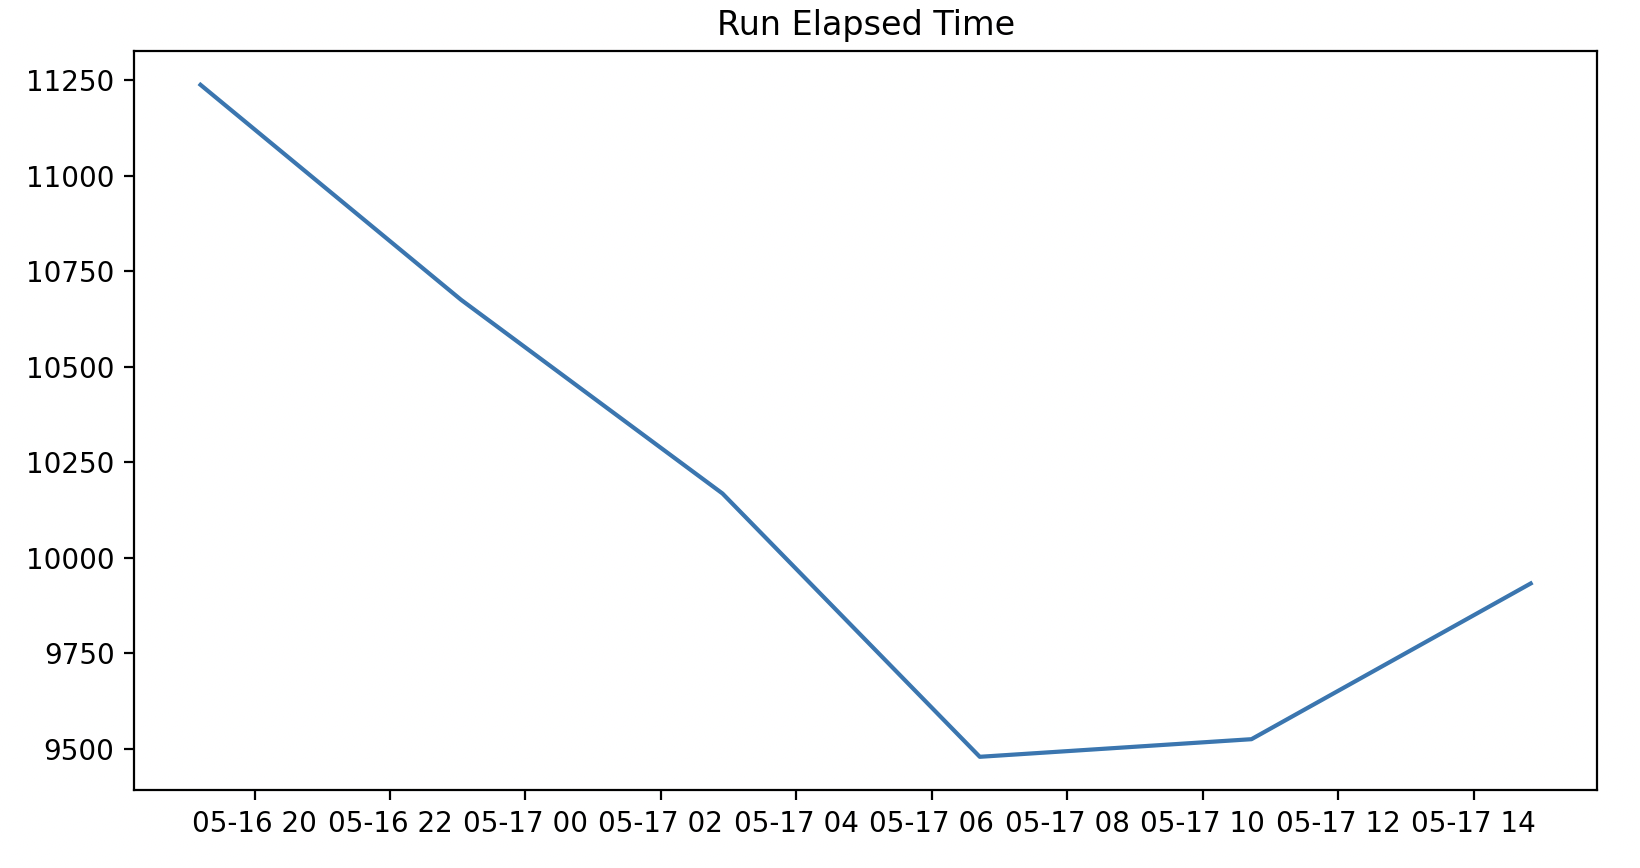
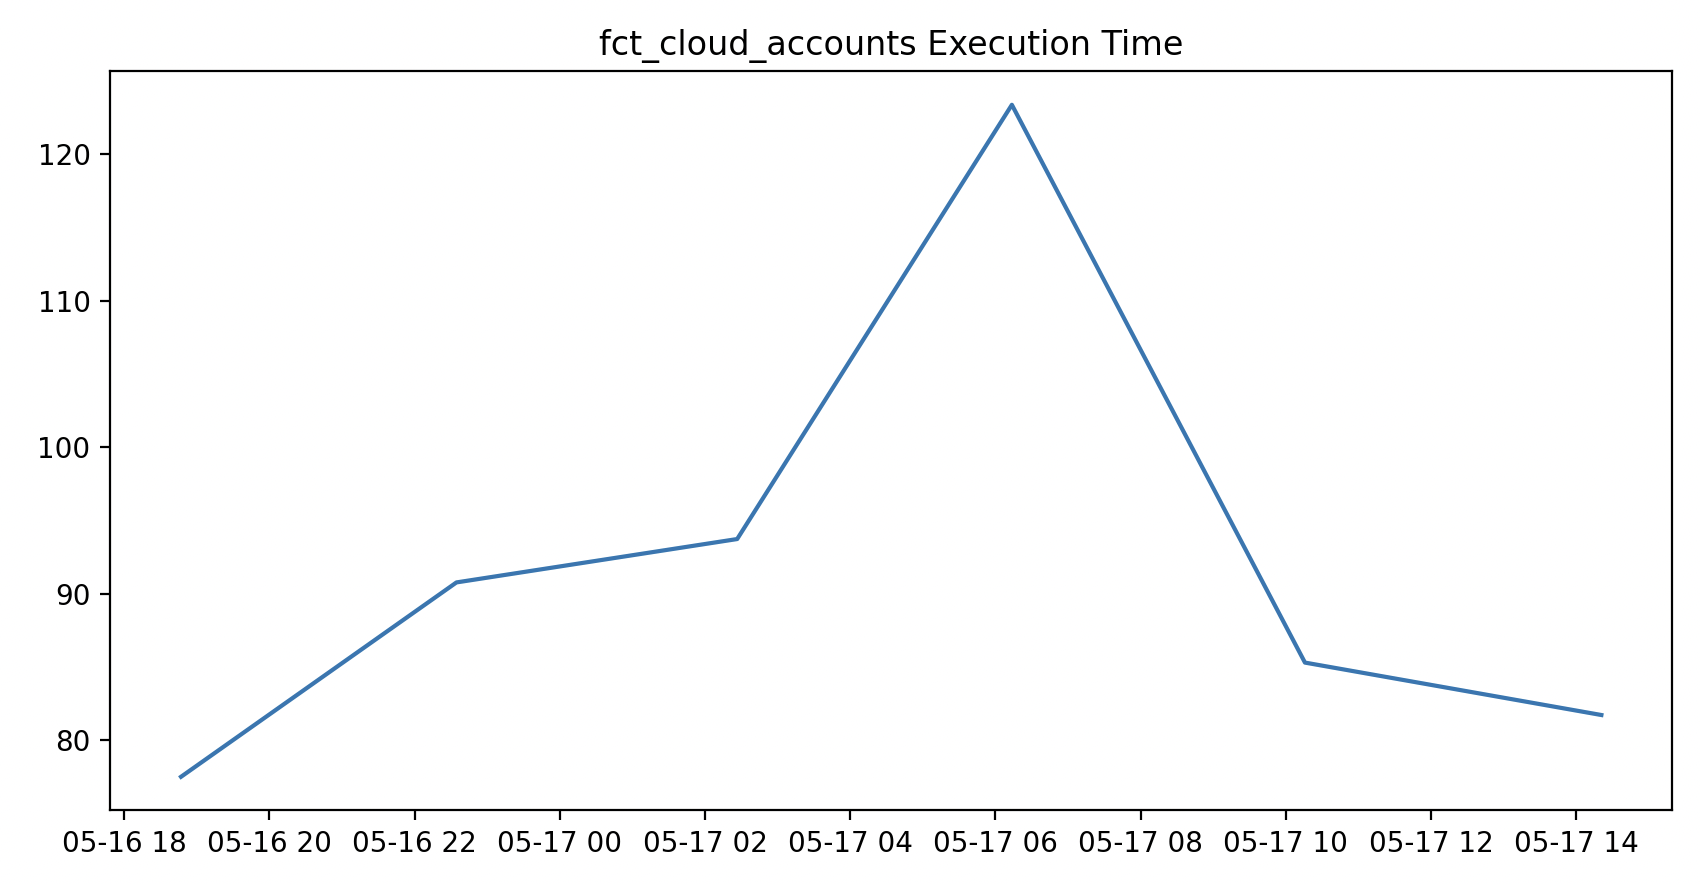
- Use the query results to plot a graph of the longest running model’s historical run time and execution time trends.
# Import libraries
import os
import matplotlib.pyplot as plt
import pandas as pd
import requests

# Set API key
auth_token = *[SERVICE_TOKEN_HERE]*

# Query the API
def query_discovery_api(auth_token, gql_query, variables):
    response = requests.post('https://metadata.cloud.getdbt.com/graphql',
        headers={"authorization": "Bearer "+auth_token, "content-type": "application/json"},
        json={"query": gql_query, "variables": variables})
    data = response.json()['data']

    return data

# Get the latest run metadata for all models
models_latest_metadata = query_discovery_api(auth_token, query_one, variables_query_one)['environment']

# Convert to dataframe
models_df = pd.DataFrame([x['node'] for x in models_latest_metadata['applied']['models']['edges']])

# Unnest the executionInfo column
models_df = pd.concat([models_df.drop(['executionInfo'], axis=1), models_df['executionInfo'].apply(pd.Series)], axis=1)

# Sort the models by execution time
models_df_sorted = models_df.sort_values('executionTime', ascending=False)

print(models_df_sorted)

# Get the uniqueId of the longest running model
longest_running_model = models_df_sorted.iloc[0]['uniqueId']

# Define second query variables
variables_query_two = {
    "environmentId": *[ENVR_ID_HERE]*
    "lastRunCount": 10,
    "uniqueId": longest_running_model
}

# Get the historical run metadata for the longest running model
model_historical_metadata = query_discovery_api(auth_token, query_two, variables_query_two)['environment']['applied']['modelHistoricalRuns']

# Convert to dataframe
model_df = pd.DataFrame(model_historical_metadata)

# Filter dataframe to only successful runs
model_df = model_df[model_df['status'] == 'success']

# Convert the runGeneratedAt, executeStartedAt, and executeCompletedAt columns to datetime
model_df['runGeneratedAt'] = pd.to_datetime(model_df['runGeneratedAt'])
model_df['executeStartedAt'] = pd.to_datetime(model_df['executeStartedAt'])
model_df['executeCompletedAt'] = pd.to_datetime(model_df['executeCompletedAt'])

# Plot the runElapsedTime over time
plt.plot(model_df['runGeneratedAt'], model_df['runElapsedTime'])
plt.title('Run Elapsed Time')
plt.show()

# # Plot the executionTime over time
plt.plot(model_df['executeStartedAt'], model_df['executionTime'])
plt.title(model_df['name'].iloc[0]+" Execution Time")
plt.show()
Plotting examples:
What’s the latest state of each model?
The Discovery API provides information about the applied state of models and how they arrived in that state. You can retrieve the status information from the most recent run and most recent successful run (execution) from the environment endpoint and dive into historical runs using job-based and modelByEnvironment endpoints.
Example query
The API returns full identifier information (database.schema.alias) and the executionInfo for both the most recent run and most recent successful run from the database:
query ($environmentId: BigInt!, $first: Int!) {
  environment(id: $environmentId) {
    applied {
      models(first: $first) {
        edges {
          node {
            uniqueId
            compiledCode
            database
            schema
            alias
            materializedType
            executionInfo {
              executeCompletedAt
              lastJobDefinitionId
              lastRunGeneratedAt
              lastRunId
              lastRunStatus
              lastRunError
              lastSuccessJobDefinitionId
              runGeneratedAt
              lastSuccessRunId
            }
          }
        }
      }
    }
  }
}
What happened with my job run?
You can query the metadata at the job level to review results for specific runs. This is helpful for historical analysis of deployment performance or optimizing particular jobs.
Example query
Deprecated example:
query ($jobId: Int!, $runId: Int!) {
  models(jobId: $jobId, runId: $runId) {
    name
    status
    tests {
      name
      status
    }
  }
}
New example:
query ($jobId: BigInt!, $runId: BigInt!) {
  job(id: $jobId, runId: $runId) {
    models {
      name
      status
      tests {
        name
        status
      }
    }
  }
}
What’s changed since the last run?
Unnecessary runs incur higher infrastructure costs and load on the data team and their systems. A model doesn’t need to be run if it’s a view and there's no code change since the last run, or if it’s a table/incremental with no code change since last run and source data has not been updated since the last run.
Example query
With the API, you can compare the rawCode between the definition and applied state, and review when the sources were last loaded (source maxLoadedAt relative to model executeCompletedAt) given the materializedType of the model:
query ($environmentId: BigInt!, $first: Int!) {
  environment(id: $environmentId) {
    applied {
      models(
        first: $first
        filter: { uniqueIds: "MODEL.PROJECT.MODEL_NAME" }
      ) {
        edges {
          node {
            rawCode
            ancestors(types: [Source]) {
              ... on SourceAppliedStateNestedNode {
                freshness {
                  maxLoadedAt
                }
              }
            }
            executionInfo {
              runGeneratedAt
              executeCompletedAt
            }
            materializedType
          }
        }
      }
    }
    definition {
      models(
        first: $first
        filter: { uniqueIds: "MODEL.PROJECT.MODEL_NAME" }
      ) {
        edges {
          node {
            rawCode
            runGeneratedAt
            materializedType
          }
        }
      }
    }
  }
}
Quality
You can use the Discovery API to monitor data source freshness and test results to diagnose and resolve issues and drive trust in data. When used with webhooks, can also help with detecting, investigating, and alerting issues. Below lists example questions the API can help you answer. Below are example questions and queries you can run.
For quality use cases, people typically query the historical or latest applied state, often in the upstream part of the DAG (for example, sources), using the environment or environment { applied { modelHistoricalRuns } } endpoints.
Which models and tests failed to run?
By filtering on the latest status, you can get lists of models that failed to build and tests that failed during their most recent execution. This is helpful when diagnosing issues with the deployment that result in delayed or incorrect data.
Example query with code
- Get the latest run results across all jobs in the environment and return only the models and tests that errored/failed.
query ($environmentId: BigInt!, $first: Int!) {
  environment(id: $environmentId) {
    applied {
      models(first: $first, filter: { lastRunStatus: error }) {
        edges {
          node {
            name
            executionInfo {
              lastRunId
            }
          }
        }
      }
      tests(first: $first, filter: { status: "fail" }) {
        edges {
          node {
            name
            executionInfo {
              lastRunId
            }
          }
        }
      }
    }
  }
}
- Review the historical execution and test failure rate (up to 20 runs) for a given model, such as a frequently used and important dataset.
query ($environmentId: BigInt!, $uniqueId: String!, $lastRunCount: Int) {
  environment(id: $environmentId) {
    applied {
      modelHistoricalRuns(uniqueId: $uniqueId, lastRunCount: $lastRunCount) {
        name
        executeStartedAt
        status
        tests {
          name
          status
        }
      }
    }
  }
}
- Identify the runs and plot the historical trends of failure/error rates.
When was the data my model uses last refreshed?
You can get the metadata on the latest execution for a particular model or across all models in your project. For instance, investigate when each model or snapshot that's feeding into a given model was last executed or the source or seed was last loaded to gauge the freshness of the data.
Example query with code
query ($environmentId: BigInt!, $first: Int!) {
  environment(id: $environmentId) {
    applied {
      models(
        first: $first
        filter: { uniqueIds: "MODEL.PROJECT.MODEL_NAME" }
      ) {
        edges {
          node {
            name
            ancestors(types: [Model, Source, Seed, Snapshot]) {
              ... on ModelAppliedStateNestedNode {
                name
                resourceType
                materializedType
                executionInfo {
                  executeCompletedAt
                }
              }
              ... on SourceAppliedStateNestedNode {
                sourceName
                name
                resourceType
                freshness {
                  maxLoadedAt
                }
              }
              ... on SnapshotAppliedStateNestedNode {
                name
                resourceType
                executionInfo {
                  executeCompletedAt
                }
              }
              ... on SeedAppliedStateNestedNode {
                name
                resourceType
                executionInfo {
                  executeCompletedAt
                }
              }
            }
          }
        }
      }
    }
  }
}
# Extract graph nodes from response
def extract_nodes(data):
    models = []
    sources = []
    groups = []
    for model_edge in data["applied"]["models"]["edges"]:
        models.append(model_edge["node"])
    for source_edge in data["applied"]["sources"]["edges"]:
        sources.append(source_edge["node"])
    for group_edge in data["definition"]["groups"]["edges"]:
        groups.append(group_edge["node"])
    models_df = pd.DataFrame(models)
    sources_df = pd.DataFrame(sources)
    groups_df = pd.DataFrame(groups)

    return models_df, sources_df, groups_df

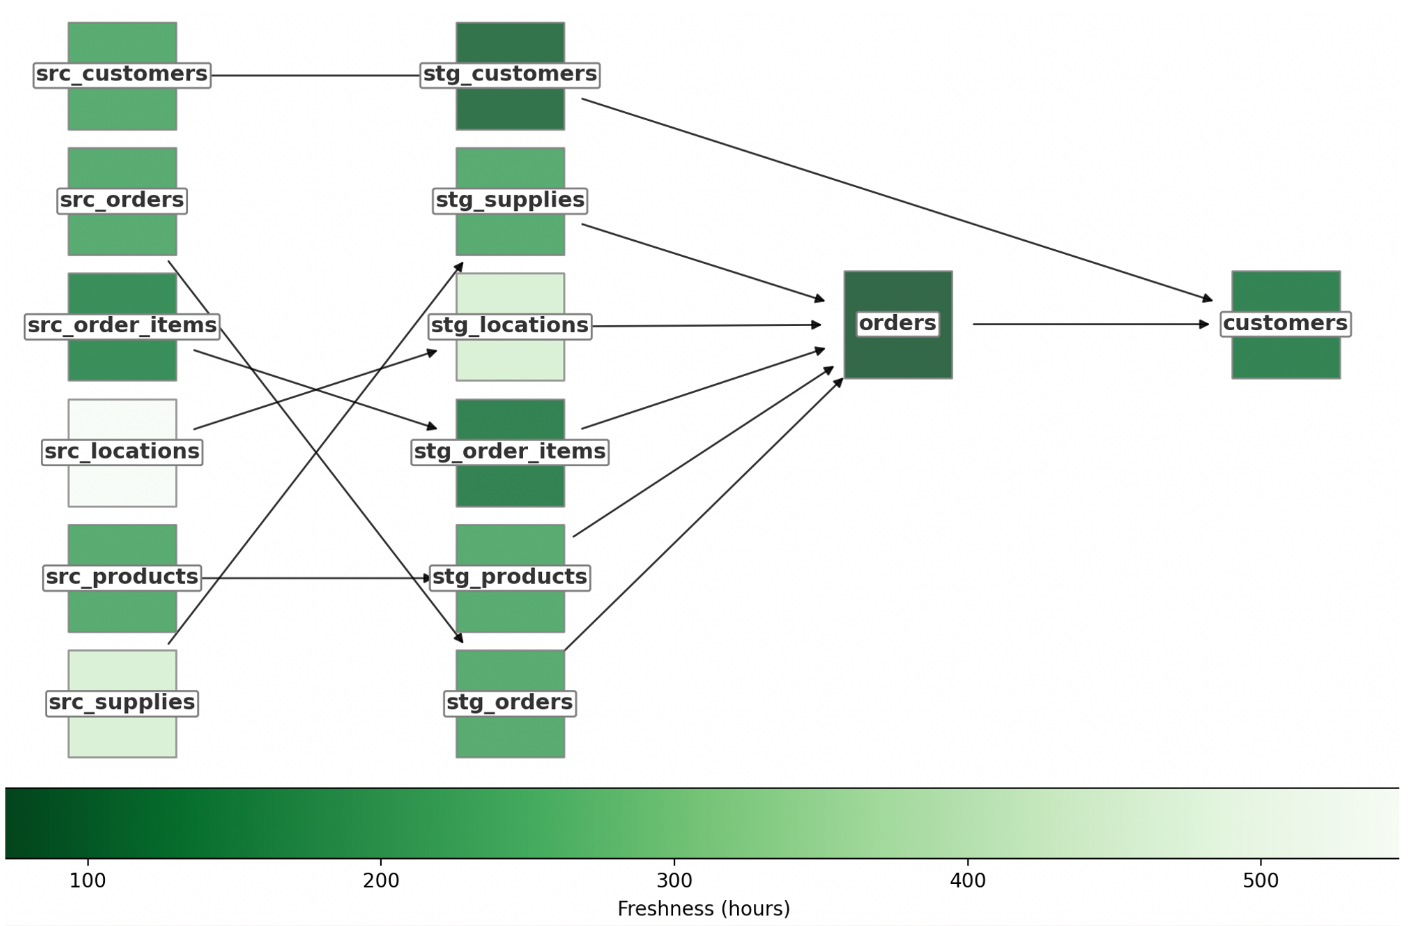
# Construct a lineage graph with freshness info
def create_freshness_graph(models_df, sources_df):
    G = nx.DiGraph()
    current_time = datetime.now(timezone.utc)
    for _, model in models_df.iterrows():
        max_freshness = pd.Timedelta.min
        if "meta" in models_df.columns:
          freshness_sla = model["meta"]["freshness_sla"]
        else:
          freshness_sla = None
        if model["executionInfo"]["executeCompletedAt"] is not None:
          model_freshness = current_time - pd.Timestamp(model["executionInfo"]["executeCompletedAt"])
          for ancestor in model["ancestors"]:
              if ancestor["resourceType"] == "SourceAppliedStateNestedNode":
                  ancestor_freshness = current_time - pd.Timestamp(ancestor["freshness"]['maxLoadedAt'])
              elif ancestor["resourceType"] == "ModelAppliedStateNestedNode":
                  ancestor_freshness = current_time - pd.Timestamp(ancestor["executionInfo"]["executeCompletedAt"])

              if ancestor_freshness > max_freshness:
                  max_freshness = ancestor_freshness

          G.add_node(model["uniqueId"], name=model["name"], type="model", max_ancestor_freshness = max_freshness, freshness = model_freshness, freshness_sla=freshness_sla)
    for _, source in sources_df.iterrows():
        if source["maxLoadedAt"] is not None:
          G.add_node(source["uniqueId"], name=source["name"], type="source", freshness=current_time - pd.Timestamp(source["maxLoadedAt"]))
    for _, model in models_df.iterrows():
        for parent in model["parents"]:
            G.add_edge(parent["uniqueId"], model["uniqueId"])

    return G
Graph example:
Are my data sources fresh?
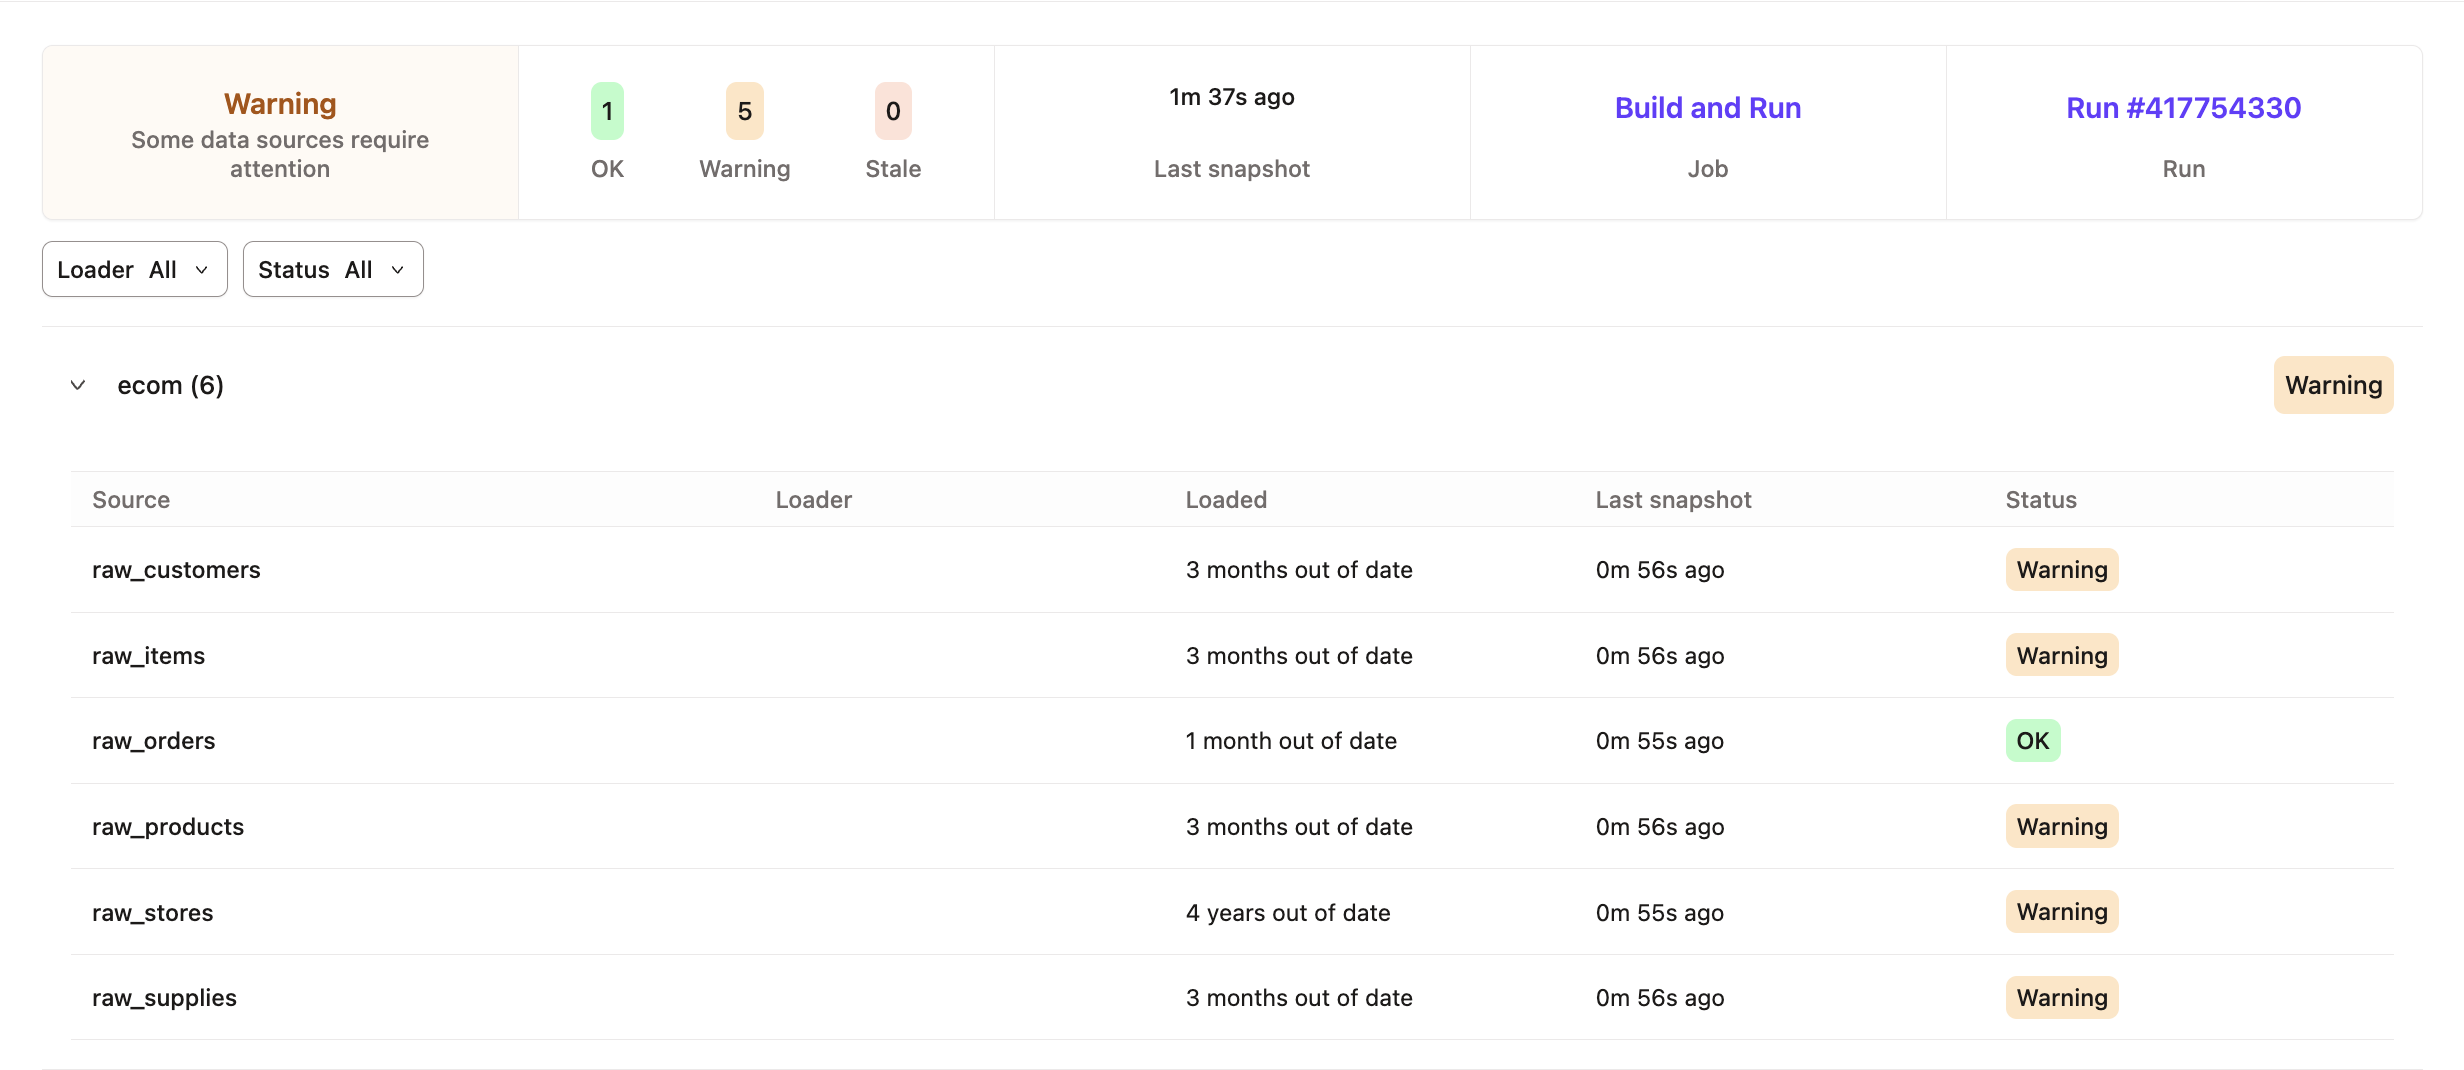
Checking source freshness allows you to ensure that sources loaded and used in your dbt project are compliant with expectations. The API provides the latest metadata about source loading and information about the freshness check criteria.
Example query
query ($environmentId: BigInt!, $first: Int!) {
  environment(id: $environmentId) {
    applied {
      sources(
        first: $first
        filter: { freshnessChecked: true, database: "production" }
      ) {
        edges {
          node {
            sourceName
            name
            identifier
            loader
            freshness {
              freshnessJobDefinitionId
              freshnessRunId
              freshnessRunGeneratedAt
              freshnessStatus
              freshnessChecked
              maxLoadedAt
              maxLoadedAtTimeAgoInS
              snapshottedAt
              criteria {
                errorAfter {
                  count
                  period
                }
                warnAfter {
                  count
                  period
                }
              }
            }
          }
        }
      }
    }
  }
}
What’s the test coverage and status?
Data tests are an important way to ensure that your stakeholders are reviewing high-quality data. You can execute tests during a dbt run. The Discovery API provides complete test results for a given environment or job, which it represents as the children of a given node that’s been tested (for example, a model).
Example query
For the following example, the parents are the nodes (code) that's being tested and executionInfo describes the latest test results:
query ($environmentId: BigInt!, $first: Int!) {
  environment(id: $environmentId) {
    applied {
      tests(first: $first) {
        edges {
          node {
            name
            columnName
            parents {
              name
              resourceType
            }
            executionInfo {
              lastRunStatus
              lastRunError
              executeCompletedAt
              executionTime
            }
          }
        }
      }
    }
  }
}
How is this model contracted and versioned?
To enforce the shape of a model's definition, you can define contracts on models and their columns. You can also specify model versions to keep track of discrete stages in its evolution and use the appropriate one.
Example query
query {
  environment(id: 123) {
    applied {
      models(first: 100, filter: { access: public }) {
        edges {
          node {
            name
            latestVersion
            contractEnforced
            constraints {
              name
              type
              expression
              columns
            }
            catalog {
              columns {
                name
                type
              }
            }
          }
        }
      }
    }
  }
}
Discovery
You can use the Discovery API to find and understand relevant datasets and semantic nodes with rich context and metadata. Below are example questions and queries you can run.
For discovery use cases, people typically query the latest applied or definition state, often in the downstream part of the DAG (for example, mart models or metrics), using the environment endpoint.
What does this dataset and its columns mean?
Query the Discovery API to map a table/view in the data platform to the model in the dbt project; then, retrieve metadata about its meaning, including descriptive metadata from its YAML file and catalog information from its YAML file and the schema.
Example query
query ($environmentId: BigInt!, $first: Int!) {
  environment(id: $environmentId) {
    applied {
      models(
        first: $first
        filter: {
          database: "analytics"
          schema: "prod"
          identifier: "customers"
        }
      ) {
        edges {
          node {
            name
            description
            tags
            meta
            catalog {
              columns {
                name
                description
                type
              }
            }
          }
        }
      }
    }
  }
}
What's the full data lineage at a model level?
The Discovery API enables access to comprehensive model-level data lineage by exposing:
- Upstream dependencies of models, including relationships to sources, seeds, and snapshots
- Model execution metadata such as run status, execution time, and freshness
- Column-level details, including tests and descriptions
- References between models to reconstruct lineage across your project
Example query
Here's a GraphQL query example that retrieves full model-level data lineage using the Discovery API:
query ($environmentId: BigInt!, $first: Int!) {
  environment(id: $environmentId) {
    applied {
      models(first: $first) {
        edges {
          node {
            name
            ancestors(types: [Model, Source, Seed, Snapshot]) {
              ... on ModelAppliedStateNestedNode {
                name
                resourceType
              }
              ... on SourceAppliedStateNestedNode {
                sourceName
                name
                resourceType
              }
            }
          }
        }
      }
    }
  }
}
Which metrics are available?
You can define and query metrics using the Semantic Layer, use them for documentation purposes (like for a data catalog), and calculate aggregations (like in a BI tool that doesn’t query the SL).
Example query
query ($environmentId: BigInt!, $first: Int!) {
  environment(id: $environmentId) {
    definition {
      metrics(first: $first) {
        edges {
          node {
            name
            description
            type
            formula
            filter
            tags
            parents {
              name
              resourceType
            }
          }
        }
      }
    }
  }
}
Governance
You can use the Discovery API to audit data development and facilitate collaboration within and between teams.
For governance use cases, people tend to query the latest definition state, often in the downstream part of the DAG (for example, public models), using the environment endpoint.
Who is responsible for this model?
You can define and surface the groups each model is associated with. Groups contain information like owner. This can help you identify which team owns certain models and who to contact about them.
Example query
query ($environmentId: BigInt!, $first: Int!) {
  environment(id: $environmentId) {
    applied {
      models(first: $first, filter: { uniqueIds: ["MODEL.PROJECT.NAME"] }) {
        edges {
          node {
            name
            description
            resourceType
            access
            group
          }
        }
      }
    }
    definition {
      groups(first: $first) {
        edges {
          node {
            name
            resourceType
            models {
              name
            }
            ownerName
            ownerEmail
          }
        }
      }
    }
  }
}
Who can use this model?
You can enable people the ability to specify the level of access for a given model. In the future, public models will function like APIs to unify project lineage and enable reuse of models using cross-project refs.
Example query
query ($environmentId: BigInt!, $first: Int!) {
  environment(id: $environmentId) {
    definition {
      models(first: $first) {
        edges {
          node {
            name
            access
          }
        }
      }
    }
  }
}
query ($environmentId: BigInt!, $first: Int!) {
  environment(id: $environmentId) {
    definition {
      models(first: $first, filter: { access: public }) {
        edges {
          node {
            name
          }
        }
      }
    }
  }
}
Development
You can use the Discovery API to understand dataset changes and usage and gauge impacts to inform project definition. Below are example questions and queries you can run.
For development use cases, people typically query the historical or latest definition or applied state across any part of the DAG using the environment endpoint.
How is this model or metric used in downstream tools?
Exposures provide a method to define how a model or metric is actually used in dashboards and other analytics tools and use cases. You can query an exposure’s definition to see how project nodes are used and query its upstream lineage results to understand the state of the data used in it, which powers use cases like a freshness and quality status tile.
Example query
Below is an example that reviews an exposure and the models used in it including when they were last executed.
query ($environmentId: BigInt!, $first: Int!) {
  environment(id: $environmentId) {
    applied {
      exposures(first: $first) {
        edges {
          node {
            name
            description
            ownerName
            url
            parents {
              name
              resourceType
              ... on ModelAppliedStateNestedNode {
                executionInfo {
                  executeCompletedAt
                  lastRunStatus
                }
              }
            }
          }
        }
      }
    }
  }
}
How has this model changed over time?
The Discovery API provides historical information about any resource in your project. For instance, you can view how a model has evolved over time (across recent runs) given changes to its shape and contents.
Example query
Review the differences in compiledCode or columns between runs or plot the “Approximate Size” and “Row Count” stats over time:
query (
  $environmentId: BigInt!
  $uniqueId: String!
  $lastRunCount: Int!
  $withCatalog: Boolean!
) {
  environment(id: $environmentId) {
    applied {
      modelHistoricalRuns(
        uniqueId: $uniqueId
        lastRunCount: $lastRunCount
        withCatalog: $withCatalog
      ) {
        name
        compiledCode
        columns {
          name
        }
        stats {
          label
          value
        }
      }
    }
  }
}
Which nodes depend on this data source?
dbt lineage begins with data sources. For a given source, you can look at which nodes are its children then iterate downstream to get the full list of dependencies.
Currently, querying beyond 1 generation (defined as a direct parent-to-child) is not supported. To see the grandchildren of a node, you need to make two queries: one to get the node and its children, and another to get the children nodes and their children.
Example query
query ($environmentId: BigInt!, $first: Int!) {
  environment(id: $environmentId) {
    applied {
      sources(
        first: $first
        filter: { uniqueIds: ["SOURCE_NAME.TABLE_NAME"] }
      ) {
        edges {
          node {
            loader
            children {
              uniqueId
              resourceType
              ... on ModelAppliedStateNestedNode {
                database
                schema
                alias
              }
            }
          }
        }
      }
    }
  }
}
Related docs
Was this page helpful?
This site is protected by reCAPTCHA and the Google Privacy Policy and Terms of Service apply.

