Examining our builds
Examining our builds
- ⌚ dbt keeps track of how long each model took to build, when it started, when it finished, its completion status (error, warn, or success), its materialization type, and much more.
- 🖼️ This information is stored in a couple files which dbt calls artifacts.
- 📊 Artifacts contain a ton of information in JSON format, so aren’t easy to read, but dbt packages the most useful bits of information into a tidy visualization for you.
- ☁️ If you’re not using dbt platform, we can still use the output of the dbt CLI to understand our runs.
Model timing
That’s where dbt’s Model Timing visualization comes in extremely handy. If we’ve set up a Job in dbt to run our models, we can use the Model Timing tab to pinpoint our longest-running models.
- 📊 At the top of the tab, the metric tiles surface the metrics that matter most: estimated critical path, peak concurrency, average active models, longest model, wall clock time, and latest start.
- ⌛ The Execution timeline shows all resources as a Gantt-style chart. You can group by resource type, folder, execution phase, thread, or no grouping, and highlight by estimated critical path, duration, or all equal — making it easy to spot your bottlenecks at a glance.
- 🔎 Use the search box to filter the timeline by resource name, and hover over any bar to see full details.
- 📈 The Concurrency over time chart shows model activity over the run duration. Each bar is split into Active models and Queued / ready, so you can see how many models were running versus waiting at any point in time. It also displays the peak concurrency reached during the run.
- 📋 The Resource details table lists every resource with its name, start time, end time, duration, execution phase, estimated critical path status, resource type, and folder.
- 1️⃣ If a job has a single dbt invocation (for example
dbt build), the model timing tab reflects the timing of all models. - 🔢 If a job includes multiple dbt commands (for example,
dbt buildfollowed bydbt compile), the model timing tab reflects only the models from the final command (dbt compile). For models executed in both commands, the chart displays the timing from the last invocation. Models that were not re-invoked in the final command retain their timing from the earlier command (dbt build).
 Metric tiles showing key run statistics including estimated critical path, peak concurrency, and longest model
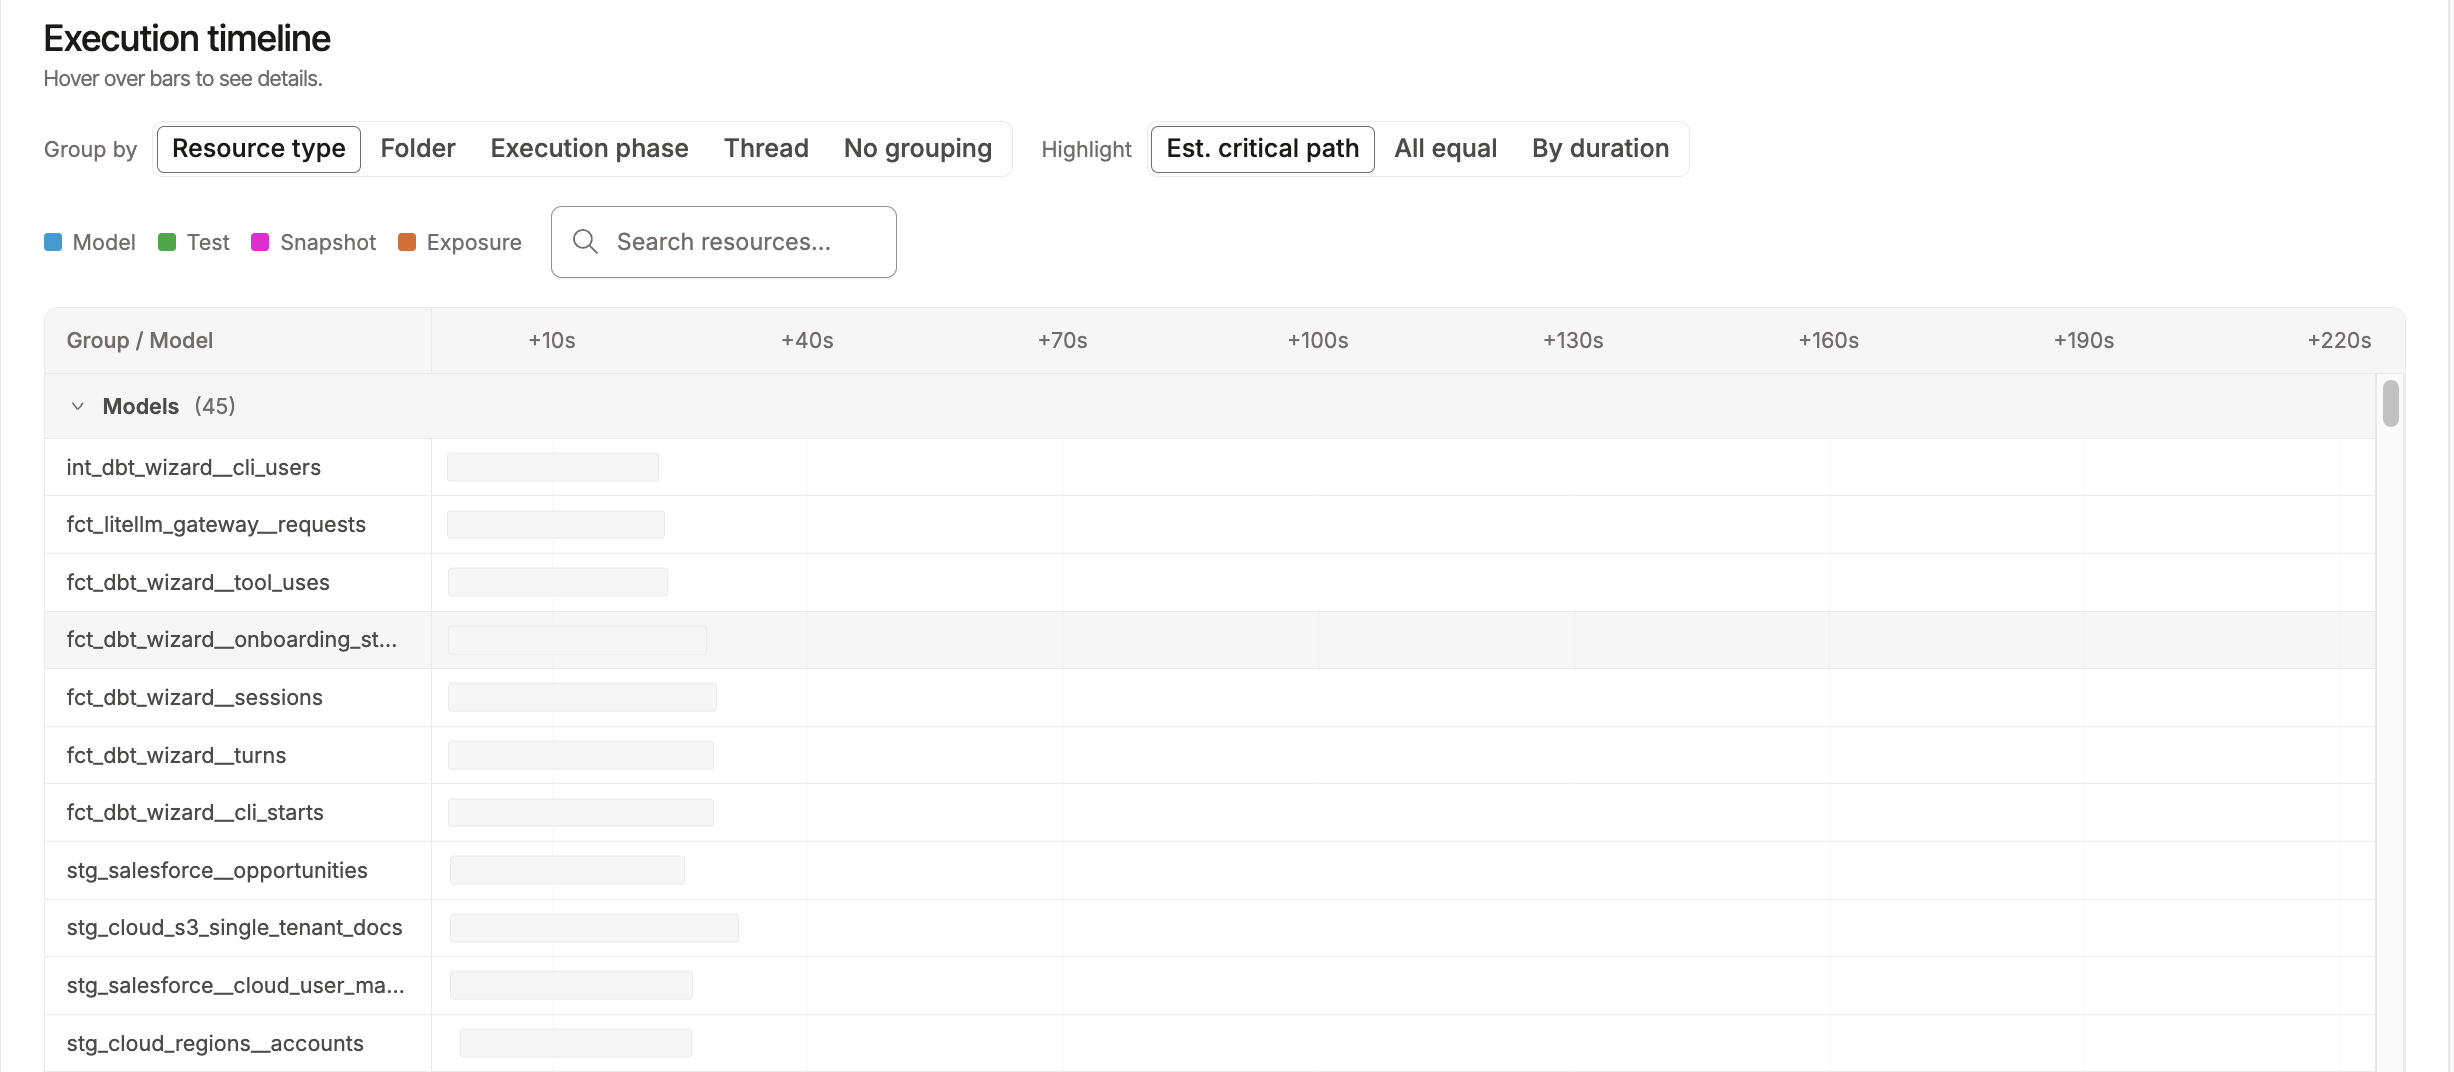 Execution timeline showing a Gantt-style view of all resources in the run
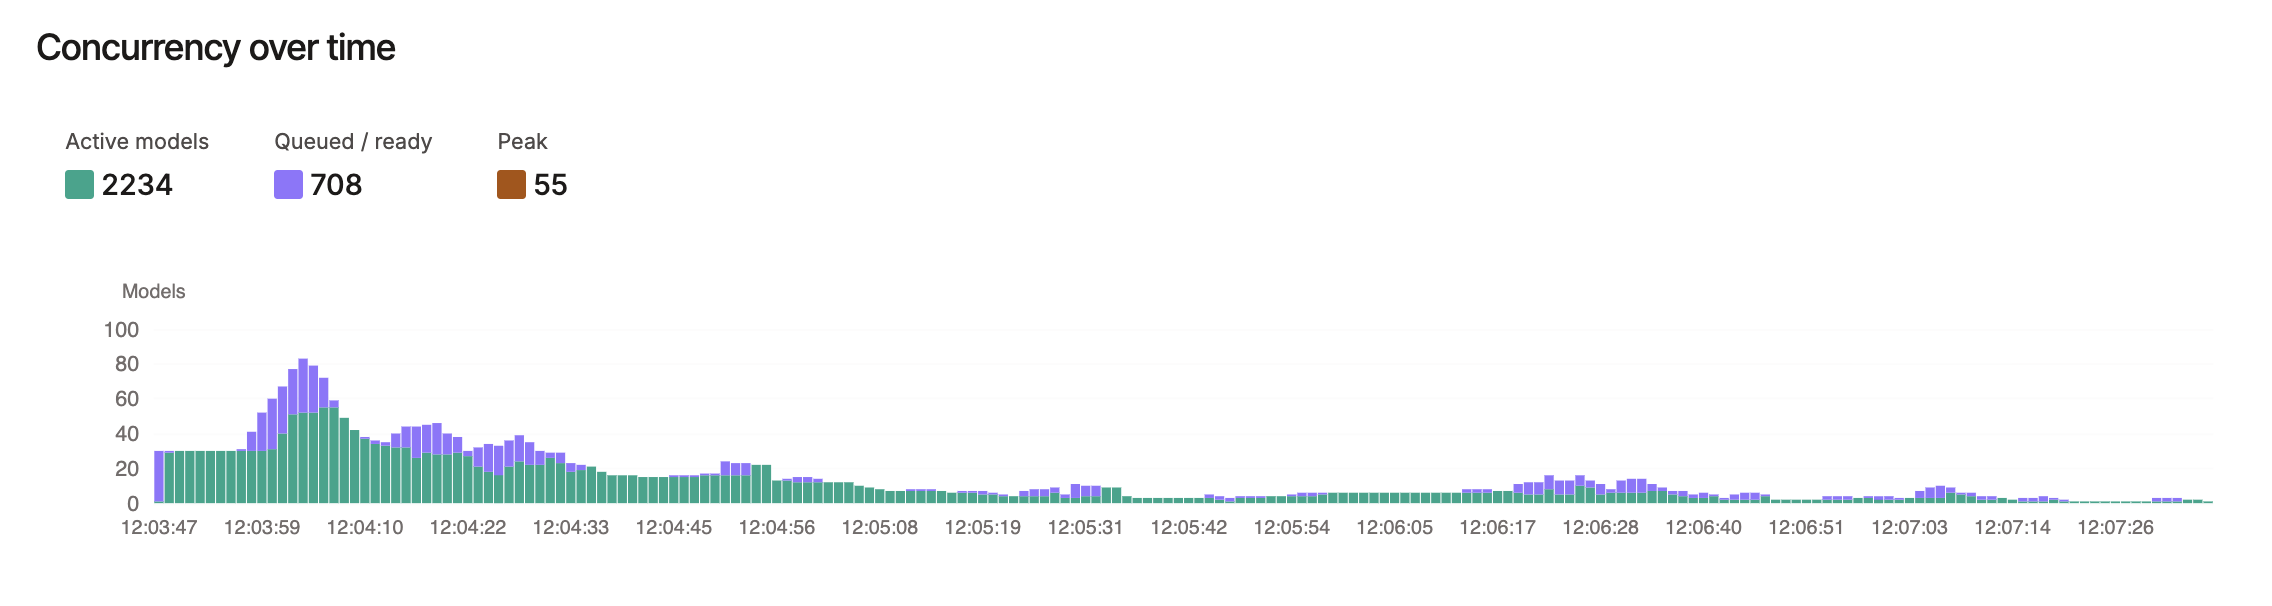 Concurrency over time chart showing active models and queued/ready models throughout the run
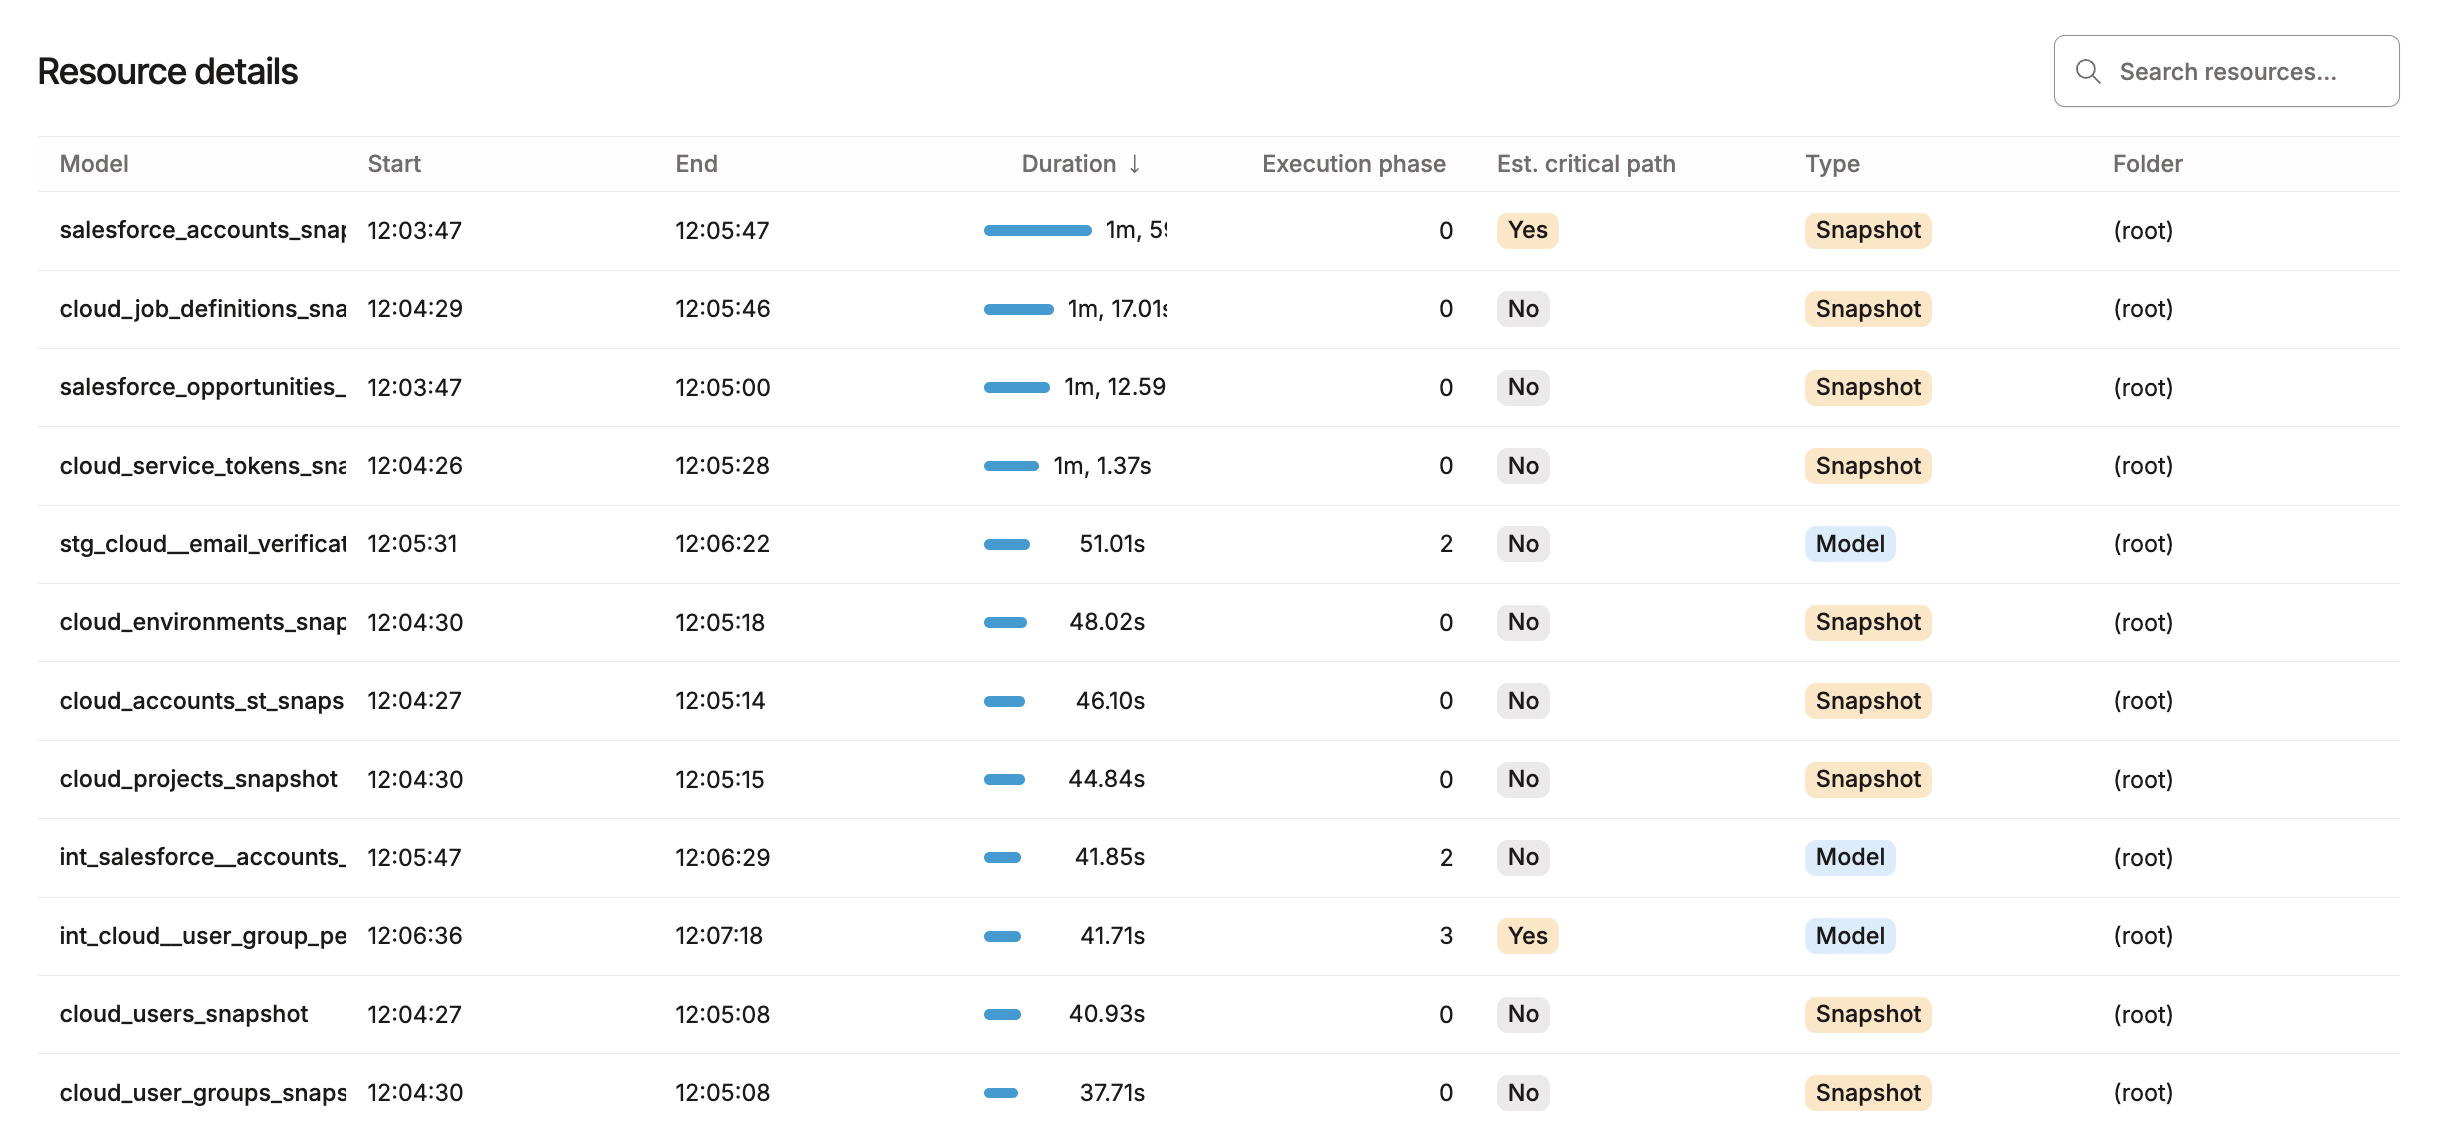 Resource details table showing each model’s start time, end time, duration, execution phase, critical path status, type, and folder
If you aren’t using dbt, that’s okay! We don’t get a fancy visualization out of the box, but we can use the output from the dbt v1 CLI to check our model times, and it’s a great opportunity to become familiar with that output.
dbt v1 CLI output
If you’ve ever run dbt, whether build, test, run or something else, you’ve seen some output like below. Let’s take a closer look at how to read this.
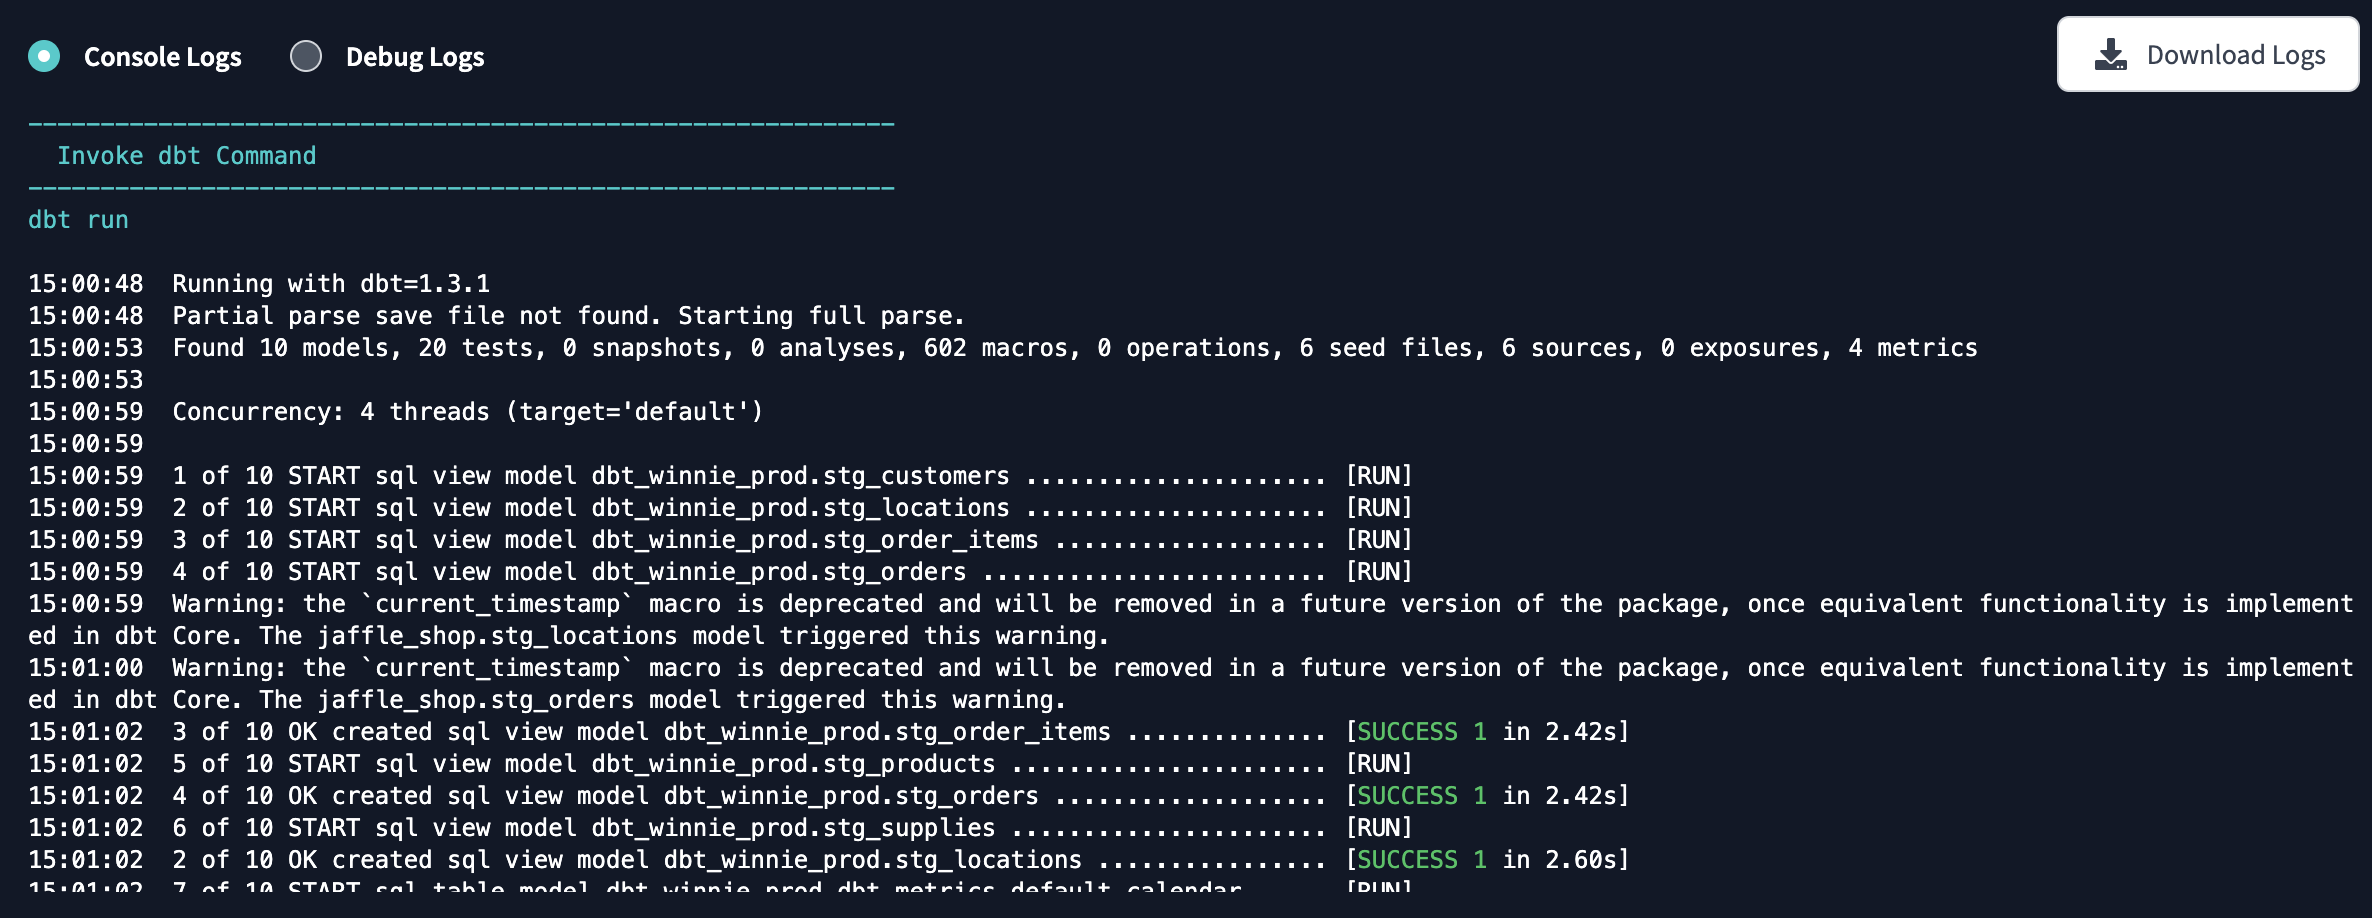
- There are two entries per model, the start of a model’s build and the completion, which will include how long the model took to run. The type of model is included as well. For example:
20:24:51  5 of 10 START sql view model main.stg_products ......... [RUN]
20:24:51  5 of 10 OK created sql view model main.stg_products .... [OK in 0.13s]
- 5️⃣ On both rows we can see that our
stg_productsmodel is the 5th of 10 objects being built, the timestamp it started at, that it was defined in SQL (as opposed to python), and that it was a view. - 🆕 On the first row we can see the timestamp of when the model started.
- ✅ On the second row — which does not necessarily come right after, thanks to threads other models can be starting and finishing as this model runs — we see the completion entry which adds the status, in this case
OK, and the time to build, a lightning-fast 0.13s. That’s not unexpected considering what we know about views. - 🏎️ Views should typically take less than a second or two, it’s tables and incremental models you’ll want to keep a closer eye on with these tools.
dbt Artifacts package
- 🎨 Lastly, when it comes to examining your dbt runs, you’re not stuck without fancy visuals if you’re using dbt v1. It’s not set up out-of-the-box, but if you want to introspect your project more deeply, you can use the dbt Artifacts package.
- 👩🎨 This provides models you can visualize for every aspect of your project at a very granular level.
- ⌚ You can use it to create your own model timing visualization in your BI tool, and any other reports you need to keep an eye on your materialization strategy.
Was this page helpful?
This site is protected by reCAPTCHA and the Google Privacy Policy and Terms of Service apply.
0