How we built consistent product launch metrics with the dbt Semantic Layer
There’s nothing quite like the feeling of launching a new product. On launch day emotions can range from excitement, to fear, to accomplishment all in the same hour. Once the dust settles and the product is in the wild, the next thing the team needs to do is track how the product is doing. How many users do we have? How is performance looking? What features are customers using? How often? Answering these questions is vital to understanding the success of any product launch.
At dbt we recently made the Semantic Layer Generally Available. The Semantic Layer lets teams define business metrics centrally, in dbt, and access them in multiple analytics tools through our semantic layer APIs. I’m a Product Manager on the Semantic Layer team, and the launch of the Semantic Layer put our team in an interesting, somewhat “meta,” position: we need to understand how a product launch is doing, and the product we just launched is designed to make defining and consuming metrics much more efficient. It’s the perfect opportunity to put the semantic layer through its paces for product analytics. This blog post walks through the end-to-end process we used to set up product analytics for the dbt Semantic Layer using the dbt Semantic Layer.
Getting your data ready for metrics
The first steps to building a product analytics pipeline with the Semantic Layer look the same as just using dbt - it’s all about data transformation. The steps we followed were broadly:
- Work with engineering to understand the data sources. In our case, it’s db exports from Semantic Layer Server.
- Load the data into our warehouse. We use Fivetran and Snowflake.
- Transform the data into normalized tables with dbt. This step is a classic. dbt’s bread and butter. You probably know the drill by now.
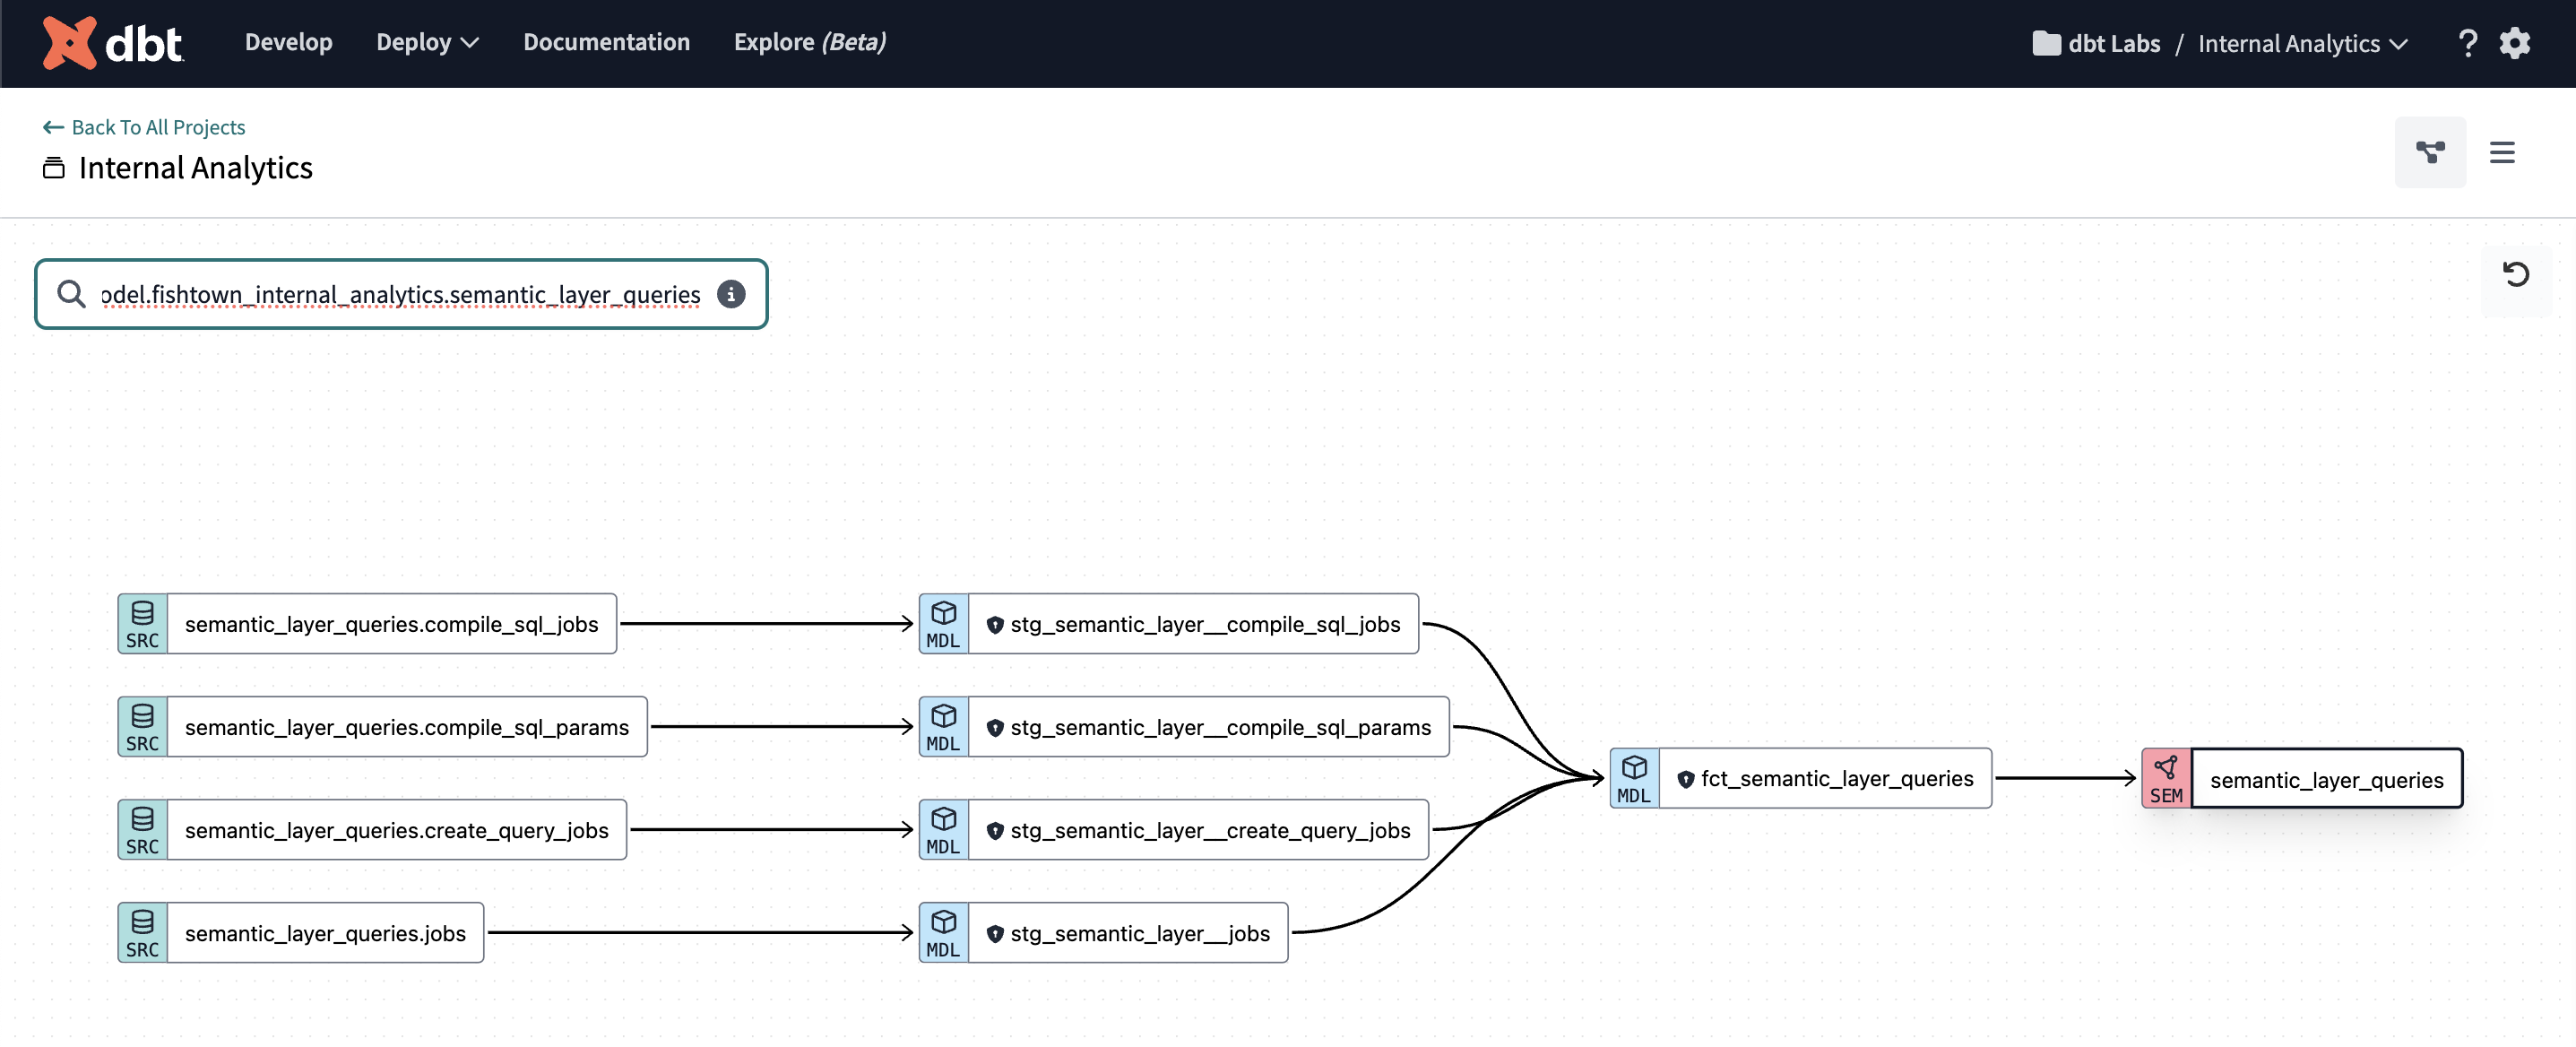
There are plenty of other great resources on how to accomplish the above steps, I’m going to skip that in this post and focus on how we built business metrics using the Semantic Layer. Once the data is loaded and modeling is complete, our DAG for the Semantic Layer data looks like the following:
Let’s walk through the DAG from left to right: First, we have raw tables from the Semantic Layer Server loaded into our warehouse, next we have staging models where we apply business logic and finally a clean, normalized fct_semantic_layer_queries model. Finally, we built a semantic model named semantic_layer_queries on top of our normalized fact model. This is a typical DAG for a dbt project that contains semantic objects. Now let’s zoom in to the section of the DAG that contains our semantic layer objects and look in more detail at how we defined our semantic layer product metrics.
How we build semantic models and metrics
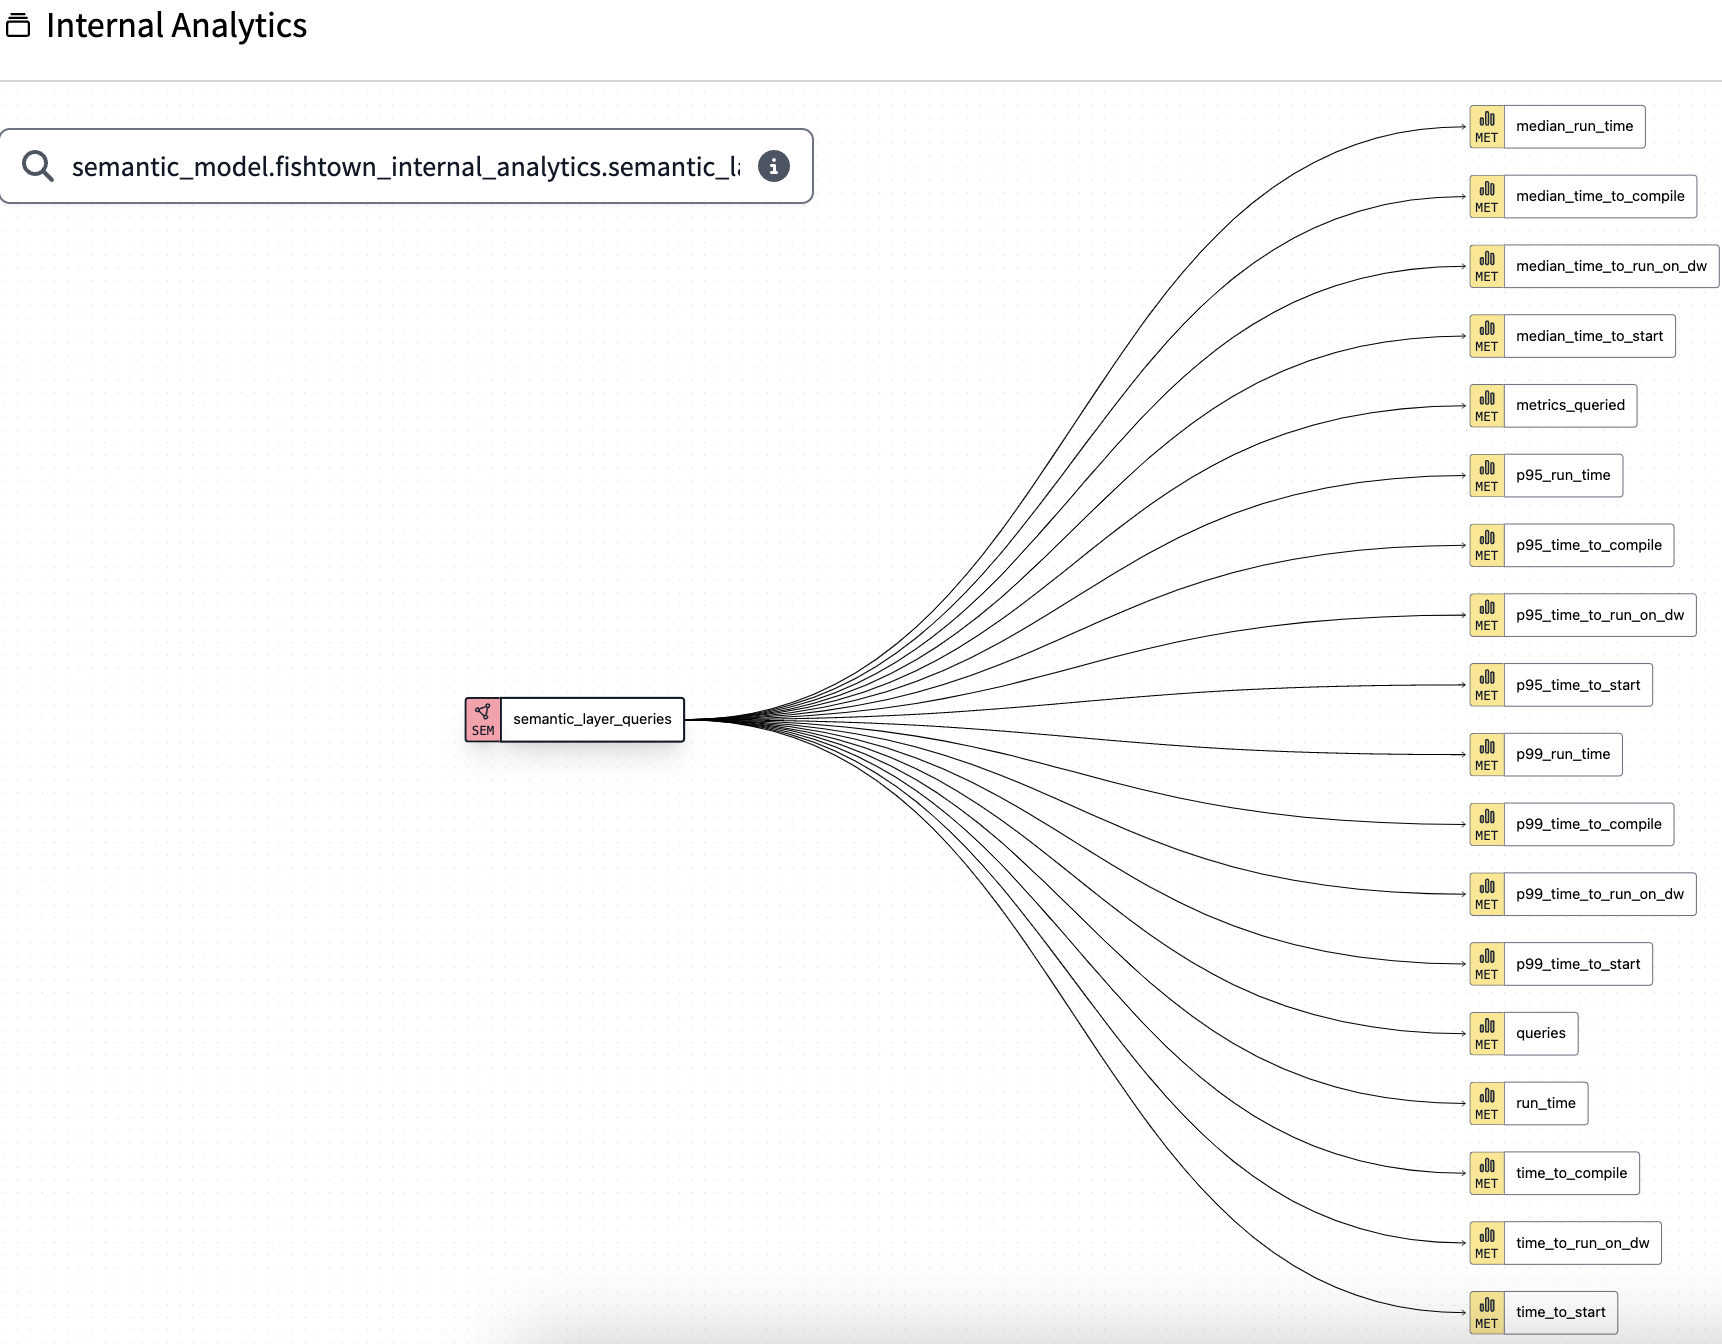
What is a semantic model? Put simply, semantic models contain the components we need to build metrics. Semantic models are YAML files that live in your dbt project. They contain metadata about your dbt models in a format that MetricFlow, the query builder that powers the semantic layer, can understand. The DAG below in dbt Explorer shows the metrics we’ve built off of semantic_layer_queries.
Let’s dig into semantic models and metrics a bit more, and explain some of the data modeling decisions we made. First, we needed to decide what model to use as a base for our semantic model. We decide to usefct_semantic_layerqueries as our base model because defining a semantic model on top of a normalized fact table gives us maximum flexibility to join to other tables. This increased the number of dimensions available, which means we can answer more questions.
You may wonder: why not just build our metrics on top of raw tables and let MetricFlow figure out the rest? The reality is, that you will almost almost always need to do some form of data modeling to create the data set you want to build your metrics off of. MetricFlow’s job isn’t to do data modeling. The transformation step is done with dbt.
Next, we had to decide what we wanted to put into our semantic models. Semantic models contain dimensions, measures, and entities. We took the following approach to add each of these components:
- Dimensions: We included all the relevant dimensions in our semantic model that stakeholders might ask for, like the time a query was created, the query status, and booleans showing if a query contained certain elements like a where filter or multiple metrics.
- Entities: We added entities to our semantic model, like dbt cloud environment id. Entities function as join keys in semantic models, which means any other semantic models that have a joinable entity can be used when querying metrics.
- Measures: Next we added Measures. Measures define the aggregation you want to run on your data. I think of measures as a metric primitive, we’ll use them to build metrics and can reuse them to keep our code DRY.
Finally, we reference the measures defined in our semantic model to create metrics. Our initial set of usage metrics are all relatively simple aggregations. For example, the total number of queries run.
## Example of a metric definition
metrics:
  - name: queries
    description: The total number of queries run
    type: simple
    label: Semantic Layer Queries
    type_params:
      measure: queries
Having our metrics in the semantic layer is powerful in a few ways. Firstly, metric definitions and the generated SQL are centralized, and live in our dbt project, instead of being scattered across BI tools or sql clients. Secondly, the types of queries I can run are dynamic and flexible. Traditionally, I would materialize a cube or rollup table which needs to contain all the different dimensional slices my users might be curious about. Now, users can join tables and add dimensionality to their metrics queries on the fly at query time, saving our data team cycles of updating and adding new fields to rollup tables. Thirdly, we can expose these metrics to a variety of downstream BI tools so stakeholders in product, finance, or GTM can understand product performance regardless of their technical skills.
Now that we’ve done the pipeline work to set up our metrics for the semantic layer launch we’re ready to analyze how the launch went!
Our Finance, Operations and GTM teams are all looking at the same metrics 😊
To query to Semantic Layer you have two paths: you can query metrics directly through the Semantic Layer APIs or use one of our first-class integrations. Our analytics team and product teams are big Hex users, while our operations and finance teams live and breathe Google Sheets, so it’s important for us to have the same metric definitions available in both tools.
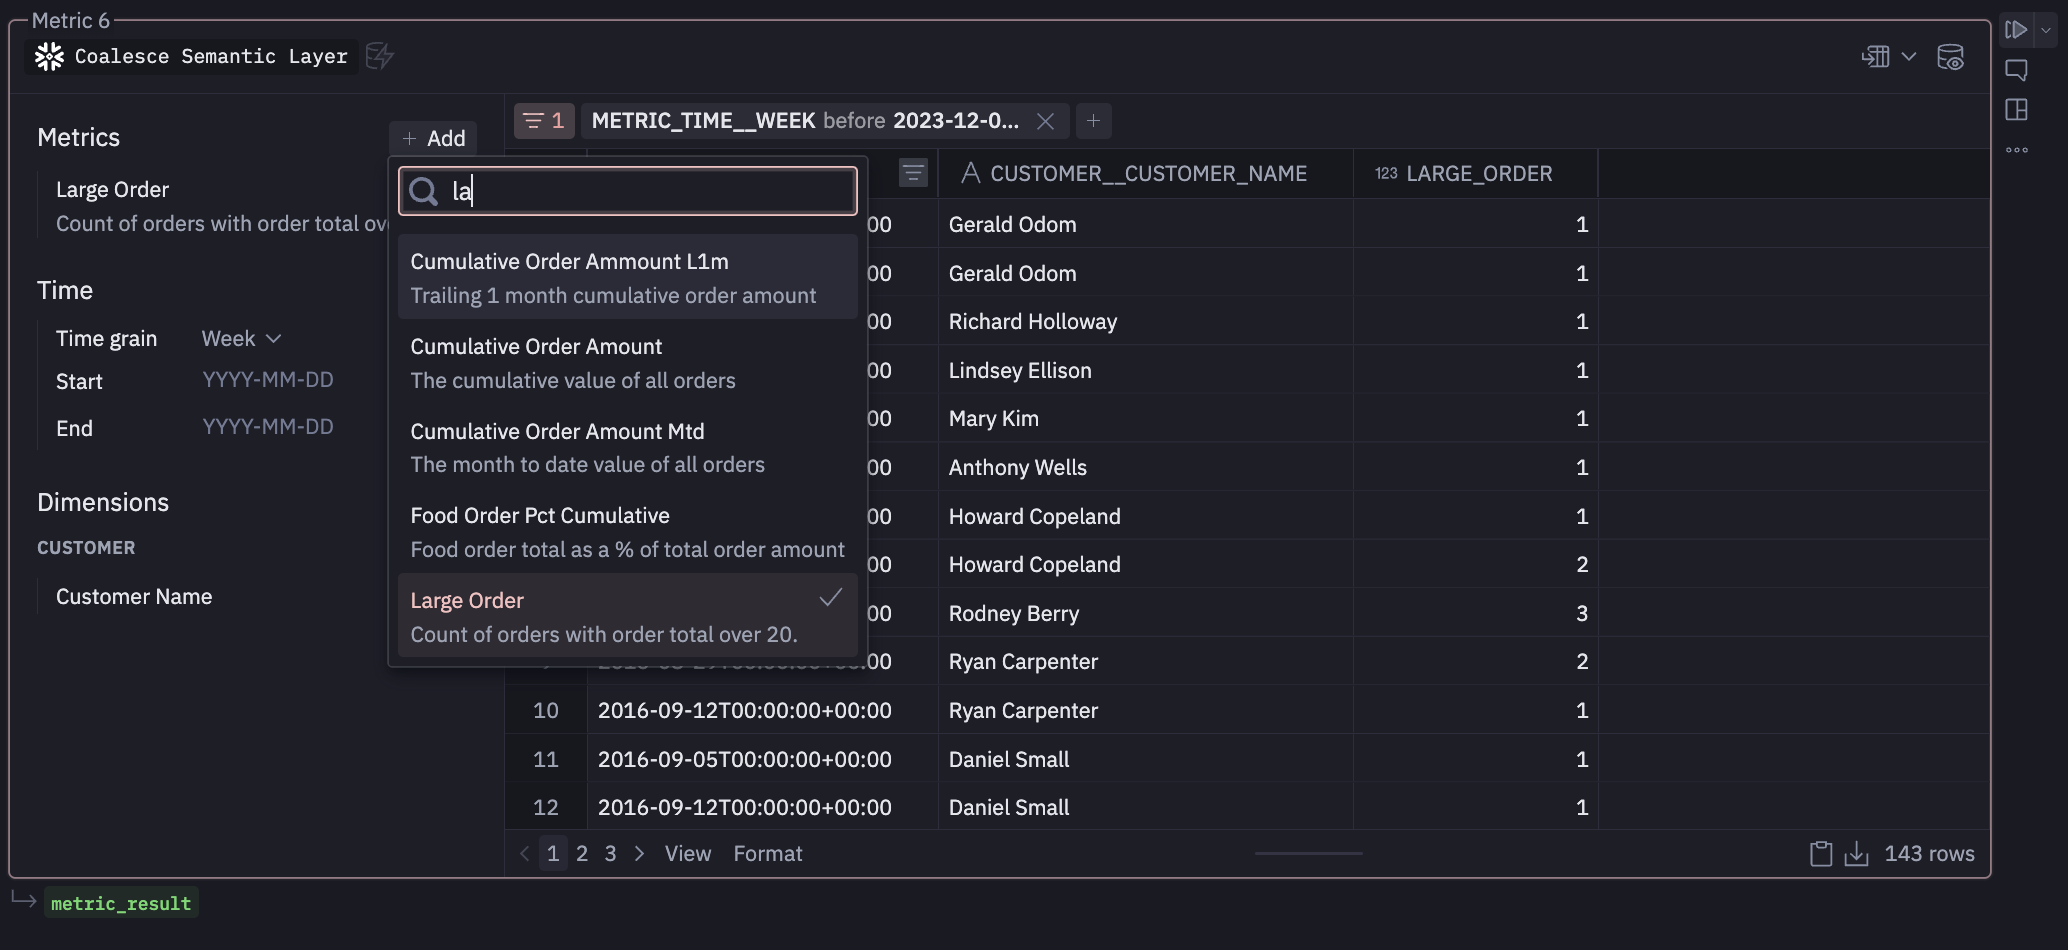
The leg work of building our pipeline and defining metrics is all done, which makes last-mile consumption much easier. First, we set up a launch dashboard in Hex as the source of truth for semantic layer product metrics. This tool is used by cross-functional partners like marketing, sales, and the executive team to easily check product and usage metrics like total semantic layer queries, or weekly active semantic layer users. To set up our Hex connection, we simply enter a few details from our dbt Cloud environment and then we can work with metrics directly in Hex notebooks. We can use the JDBC interface, or use Hex’s GUI metric builder to build reports. We run all our WBRs off this dashboard, which allows us to spot trends in consumption and react quickly to changes in our business.
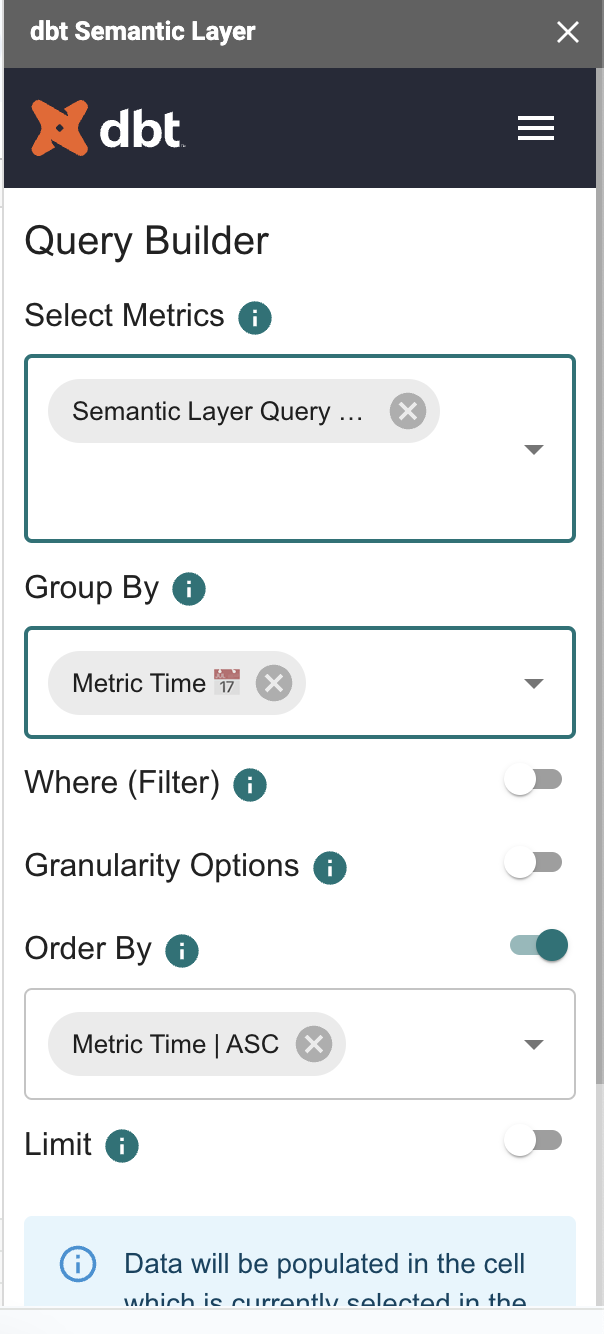
On the finance and operations side, product usage data is crucial to making informed pricing decisions. All our pricing models are created in spreadsheets, so we leverage the Google Sheets integration to give those teams access to consistent data sets without the need to download CSVs from the Hex dashboard. This lets the Pricing team add dimensional slices, like tier and company size, to the data in a self-serve manner without having to request data team resources to generate those insights. This allows our finance team to iteratively build financial models and be more self-sufficient in pulling data, instead of relying on data team resources.
As a former data scientist and data engineer, I personally think this is a huge improvement over the approach I would have used without the semantic layer. My old approach would have been to materialize One Big Table with all the numeric and categorical columns I needed for analysis. Then write a ton of SQL in Hex or various notebooks to create reports for stakeholders. Inevitably I’m signing up for more development cycles to update the pipeline whenever a new dimension needs to be added or the data needs to be aggregated in a slightly different way. From a data team management perspective, using a central semantic layer saves data analysts cycles since users can more easily self-serve. At every company I’ve ever worked at, data analysts are always in high demand, with more requests than they can reasonably accomplish. This means any time a stakeholder can self-serve their data without pulling us in is a huge win.
The Result: Consistent Governed Metrics
And just like that, we have an end-to-end pipeline for product analytics on the dbt Semantic Layer using the dbt Semantic Layer 🤯. Part of the foundational work to build this pipeline will be familiar to you, like building out a normalized fact table using dbt. Hopefully walking through the next step of adding semantic models and metrics on top of those dbt models helped give you some ideas about how you can use the semantic layer for your team. Having launch metrics defined in dbt made keeping the entire organization up to date on product adoption and performance much easier. Instead of a rollup table or static materialized cubes, we added flexible metrics without rewriting logic in SQL, or adding additional tables to the end of our DAG.
The result is access to consistent and governed metrics in the tool our stakeholders are already using to do their jobs. We are able to keep the entire organization aligned and give them access to consistent, accurate data they need to do their part to make the semantic layer product successful. Thanks for reading! If you’re thinking of using the semantic layer, or have questions we’re always happy to keep the conversation going in the dbt community slack. Drop us a note in #dbt-cloud-semantic-layer. We’d love to hear from you!


Comments